Online Reporting Software
InetSoft's online reporting software is easy enough to be:
- deployed in weeks, not months
- learned by end-users with minimal training
- scale up for organizations of all sizes
agile enough to:
- grab the attention of executives
- access from any Web-enabled mobile devices including tablets, iPads, and iPhones
- meet the demands of power users
and robust enough to:
- adapt to changing data structures and business needs
- accommodate data exploration through visualization and maximum self-service
- offer secure enterprise level development and deployment


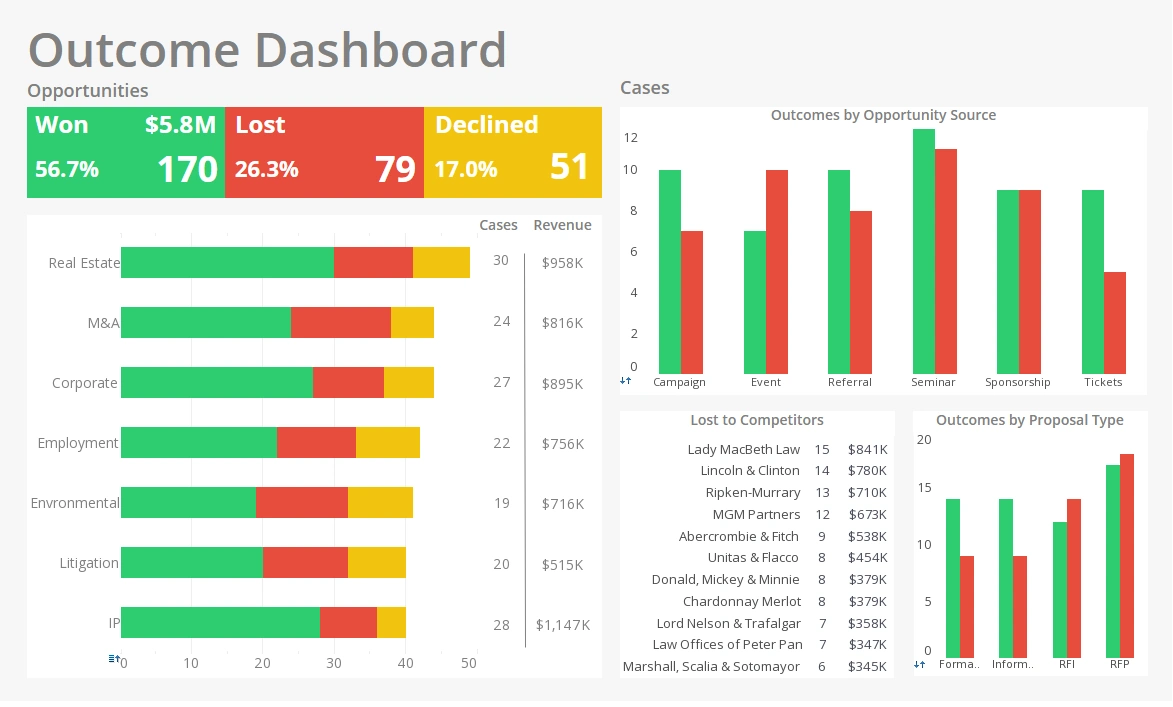
InetSoft's StyleBI software allows users to create professional reports and dashboards using a
InetSoft's StyleBI software allows users to create professional reports and dashboards using a simple point-and-click interface. StyleBI is a complete business intelligence platform thanks to its interactive interface that functions in all browsers. Its patented real-time data mashup Data Block™ architecture allows for drag-and-drop combining of data, presentation or functionality from multiple sources.
Additional Examples of Online Reporting
Who Uses Online Reporting Software?
Online reporting software is used by businesses and organizations to create online reports and dashboards for their input requirements. These tools allow viewing, creating, and editing reports through a web interface such as a web browser. Some examples of online reporting software include InetSoft, Insight Software, and Power BI.
What Kind Of Job Roles Use It?
Data analysts are responsible for gathering and organizing large sets of data—and then analyzing that data and using their analysis to draw specific business conclusions, whether that's how to effectively price products, cut costs, or improve customer retention. Other job roles that use online reporting software include project managers, engineering managers, technical project managers, business account managers, senior managers in IT and IT infrastructure management.
Is There Free Online Reporting Software?
Yes, there are free online reporting software tools available such as Qlikview Personal Edition, Qlik Sense Cloud Basic and Qlik Sense Desktop, Sisense for Cloud Data Teams, Google Data Studio, InetSoft, Microsoft Power BI Desktop, Databox and EspressReport Lite.

What Are The Features To Look For?
Here are some features to look for in online reporting software:
1. Data Visualization - The reports a reporting tool generates should be able to give you insights at a
glance. A reporting tool should have multiple data visualization types.
2. Drag-and-Drop Reporting - If you use a tool to create a report, you should be able to add components
without any difficulty.
3. Interactive Reporting Dashboards - Interactive Reporting Dashboards are a business data management tool
that allows users to interact with data by tracking, analyzing, monitoring, and displaying key business
metrics. Interactive dashboards allow executives to drill down and filter information, giving many dimensions
to data to be viewed in detail and from different perspectives. With the help of various interactive features,
users can explore the data on a deeper level and make well-informed, data-driven business decisions.
4. Static Reports - Static Reports are reports that examine data in the past and offer a snapshot of trends,
data, and information over a predetermined period to provide insight and serve as a decision-making guide.
Static reports are usually found in emails or print, shared easily and provide consistent information for a
defined period creating a unified perspective. After initial use, a static report is usually filed away and
used for the purposes of historical data analysis.
5. Live Reporting - Live Reports are reports that display data that is constantly updating and changing. Live
reports are excellent for capturing in-the-moment changes, trends or behaviors and improve the ability to
react to the moment and can help predict outcomes in the near future. Live reports update data continuously
like streaming video. When an event streams it is live and the audience shares in the experience and can
assist in determining the outcome. The audience is essentially looking at an event in real time, happening
right before their eyes.
6. Integration Support - Integration support refers to the ability of a software to integrate with other
software applications to provide a seamless experience for users. For example, InetSoft offers reporting and
tracking integrations that allow you to add and update contact records with the information you collect, then
create follow-up in InetSoft based on that data. Microsoft Learn offers Organizational Reporting service which
involves a one-time setup to configure a pipeline from Microsoft Learn to your organization using Azure Data
Share, and then you'll regularly receive the user progress and completion data in your environment once a day
and can report on it using the method you desire. ServiceNow's Reporting feature allows users to get fast
access to data and visualize data quickly using pre-defined reports and dashboards customized for each
workflow.
7. Flexibility for Customizations - Flexibility for customizations refers to the ability of a software to
allow users to tailor the dataset to their business case and make the most of the analytics data they
have.
8. Wizards - Reporting wizards are tools that help users create reports by guiding them through a series of
steps to define the report. For example, InetSoft has a Report Wizard that guides users through the process of
creating a report.

More Articles About Online Reporting
Advantage of Data Processing Software - Intelligently designed to require minimal input from a user, StyleBI preprocesses data by modifying it as it is comes into the program. Using a background environment tool called a worksheet, the end user can really plunge their hands into the processing, setting different conditions, formulas, or calculated fields to change various aspects of the data that comes through...
Articles About a Visualization Product - This is a table of contents of useful product information about, and benefits of, InetSoft's visualization capabilities built into its business intelligence software for dashboards, reporting, and analytics. Advanced Visualization - Now let's talk about advanced visualization. This one is really about time to insight. Or showing us what is beneath the tip of the iceberg. At the tip of the iceberg, that's where the BI industry does really well...
Better Than Periscope Data - When recently placed head to head in ratings by research firm G2 Crowd, InetSoft outranked BI provider Periscope Data in a majority of categories. This page will provide a breakdown of the various categories in which InetSoft outranked Periscope Data. A good BI platform will provide business users with an intuitive, easy-to-read, easy-to-use tool for monitoring their activities. When visual analytics are created properly the users are treated to highly balanced visualizations and data to enable the objectives of the organization...
Common Vocabulary Around Data - We apply the same principles of a normal manufacturing supply chain to data, and the advantage of that is that executives speak that language. As we discuss supply chains, we are really establishing a common vocabulary around data that executives can understand. The advantage of that is that executives will be more likely to fund the data, more likely to support enterprise data, more likely to pay for the business intelligence tools around data that we need in order to manage it. So it's actually a really effective expectations management tool...

Comparing InetSoft vs. BOARD - Choosing the right solution for business intelligence and automated reporting can be daunting. InetSoft and BOARD are two organizations which give robust business intelligence software for organizations to improve their operations. In a recent match up compiled by user review aggregator G2 Crowd, InetSoft won higher ratings than BOARD in 6 out of 7 general categories. InetSoft's ratings outscored BOARD's in Meets Requirements, Ease of use, Ease of Setup, Ease of Admin, Quality of Support, and Ease of Doing Business With...
Examples of Interactive Industry Dashboards - Are you curious as to how interactive web dashboards can help you explore your business data? Below are some examples of industry-specific interactive dashboards built with InetSoft's StyleBI. Click on any dashboard that interests you, and a live interactive version will open in a second tab of your web browser. You can ask questions of the data in these visualizations by moving sliders and other selection components, hovering your mouse over a given data point, or even viewing and extracting raw filtered data...
Evaluate InetSoft's Online Dashboards and Reporting Software - Are you looking for good online dashboards and reporting software? InetSoft is a pioneer in self-service dashboards and production reporting. View a demo and try interactive examples. A web-based platform enables your employees to easily collaborate on BI projects, and makes findings instantly available to all who are granted access...
Features of Financial Dashboard Software - Having a dashboard in front of you is one thing but being able to intuitively explore and analyze large sets of data with that dashboard is effectively maximizing the full capacity of the tool. InetSoft offers point-and-click controls like filter lists and range sliders that give users an all-inclusive software that makes it a low-risk, high-reward solution. Designed for all skill levels, business users can personalize pre-built dashboards, and developers can embed them into other applications...

How Do You Automate Decisions and Actions? - We see a lot of organizations looking at how to automate decisions and actions. Thinking back to the idea of embedding business intelligence in systems, organizations are certainly very much looking at how they can take decisions that are routine or repeated decisions and figure out how they can automate them using software. Lots of these things are tending in the direction of improving the idea of embedding BI. Looking again just a little closer to the user experience, self-service BI...
Reasons Why Utilities Choose InetSoft - Using StyleBI from InetSoft gave us the ability to provide a graphical representation of the key data to top management right 'out-of-the-box' and move from static tables of numbers to charts and graphics that are much easier to understand...
Service for Online Reporting - InetSoft's online reporting service can be installed and run in the cloud, on a remote server provided by Amazon web services or any other provider. Connections to a company's local and remote data sources can be set up so that the InetSoft tool pulls in data from any number of sources, no matter the location. The best part? No need for maintaining BI software on company machines that can be costly and take up massive...

Superstore Analytics Example - The dashboard provides a variety of filters to drill down and up for different granularity. The users can also filter the visualizations in the dashboard by region, state, category of products, sub-categories, and customer segments. It is also possible to filter the dashboard with 3 sliders which can determine the total amount of sales, and the amount of profit and one slider to choose the upper bound and lower bound for the order date. The dashboard is dynamic, and the filter will be applied to all the visualizations available in the dashboard...
This Year's Best Data Visualization Tool - What do business decision makers look for when choosing the best data visualization tool for their company? Factors to consider are the ability to mashup different types of data sources, the ability to import data, integration with data warehousing, options for prototyping new data, accessibility, and user-friendly features that speed up decision making...
Why InetSoft's Online Client Reporting Tools? - Visualization dashboards are the most intutive ways to understand client information. However, not all dashboards are created equal. InetSoft's web app can easily connect to client data to create self-service dashboards with rich built-in interactivity and customization...