Evaluate InetSoft's Sales Reporting Tool
Are you searching for a sales reporting tool that can keep up with your business? The Style Intelligence BI suite by InetSoft may be just what you are looking for.
StyleBI users are given intuitive tools to create highly detailed and professional reports for their organization. Administrators of these organizations can also set permissions that enable their end users to modify reports on the fly through ad hoc reporting.
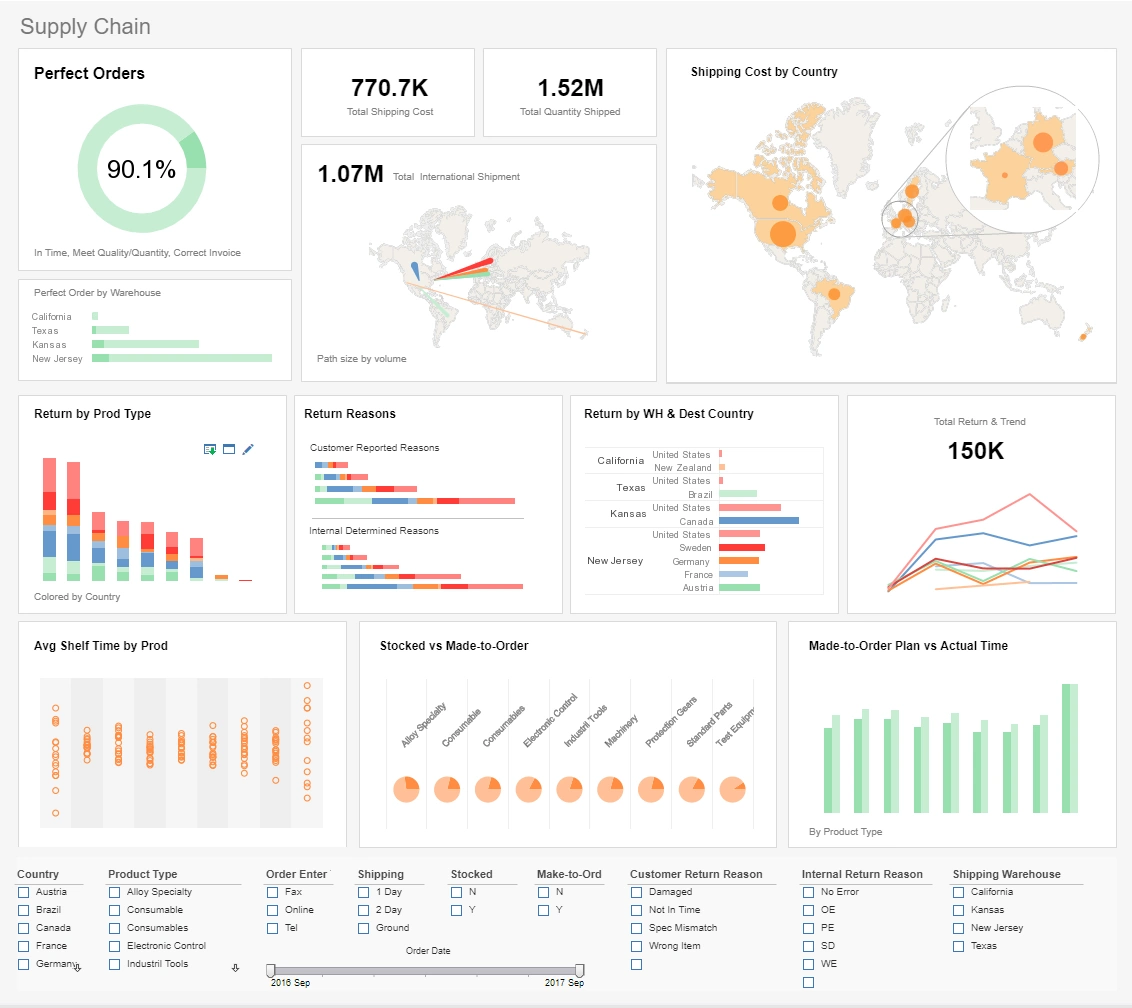
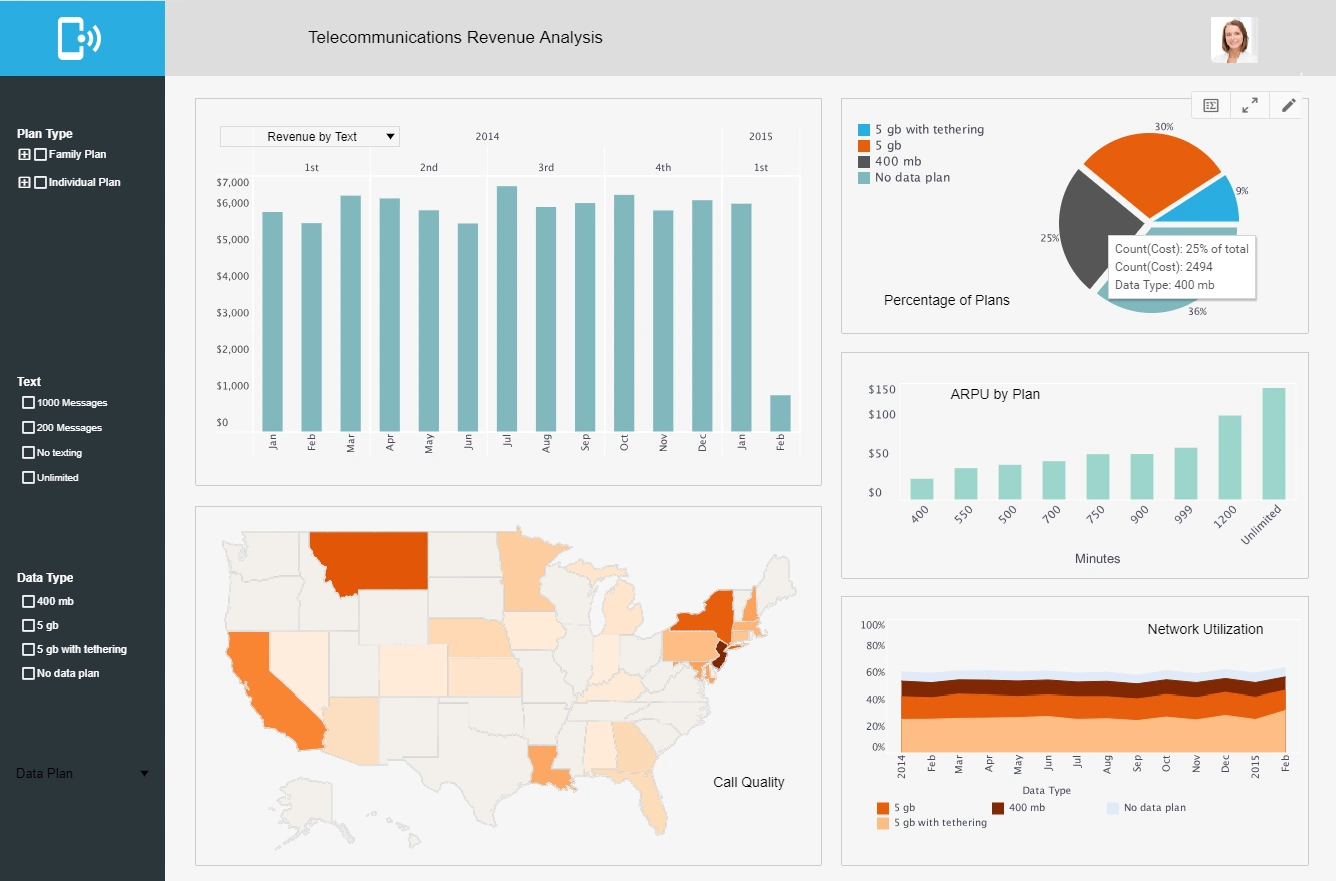
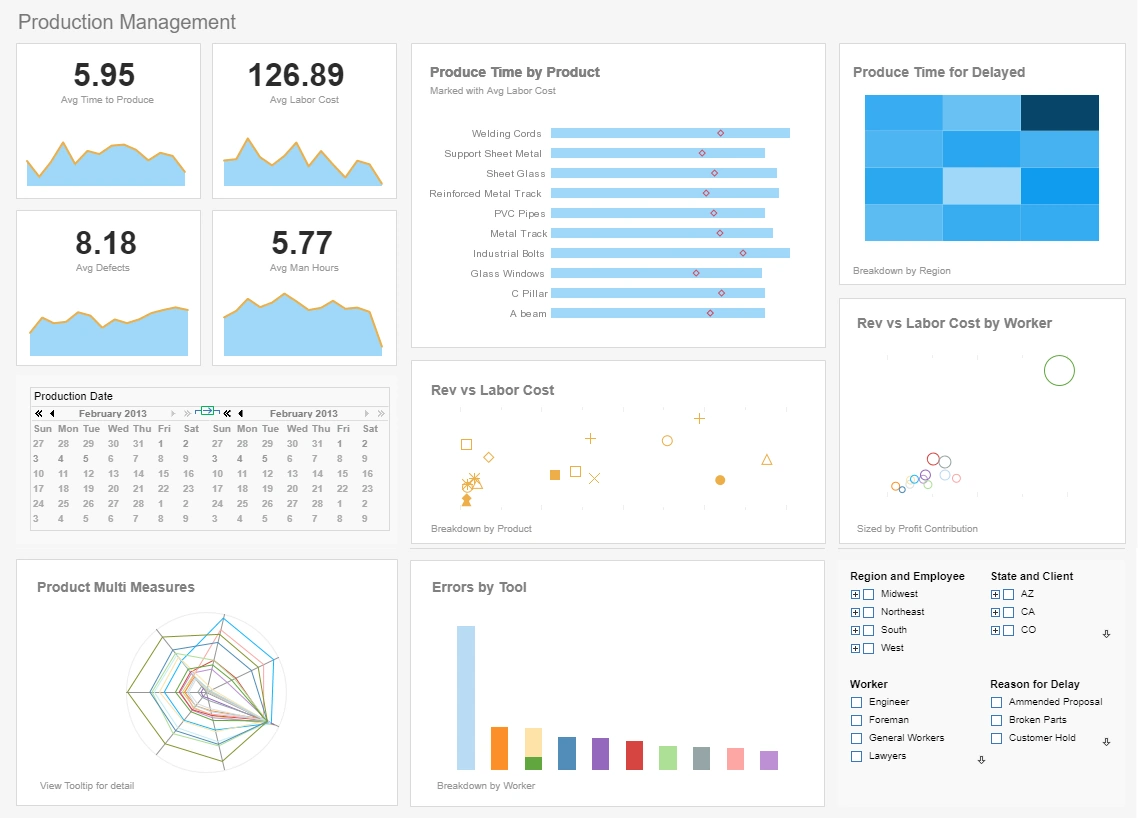
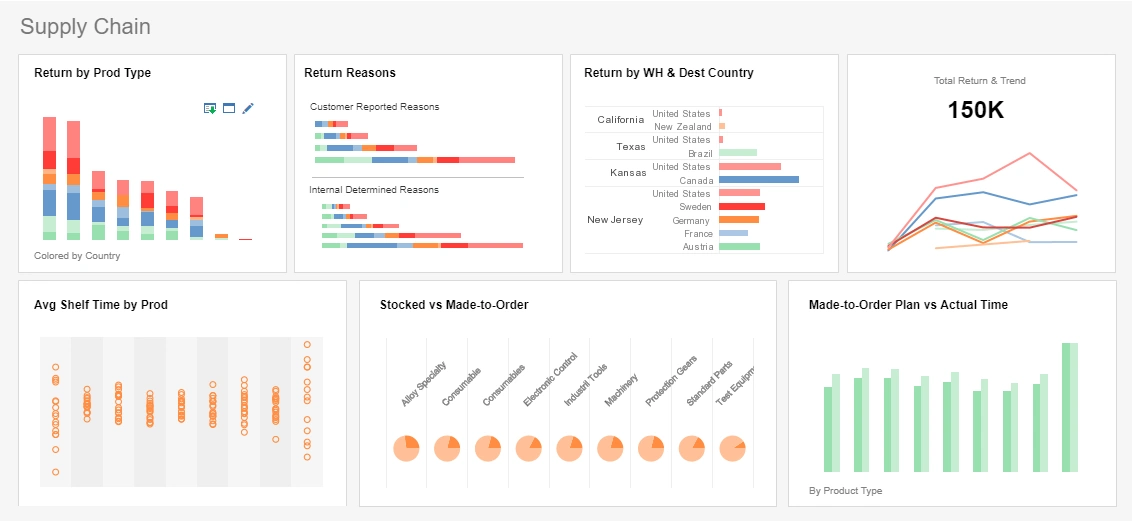
Customizable dashboards (also known as viewsheets) can be configured to report information in a less static manner. StyleBI offers 100% Web-based dashboard creation for all of its users.
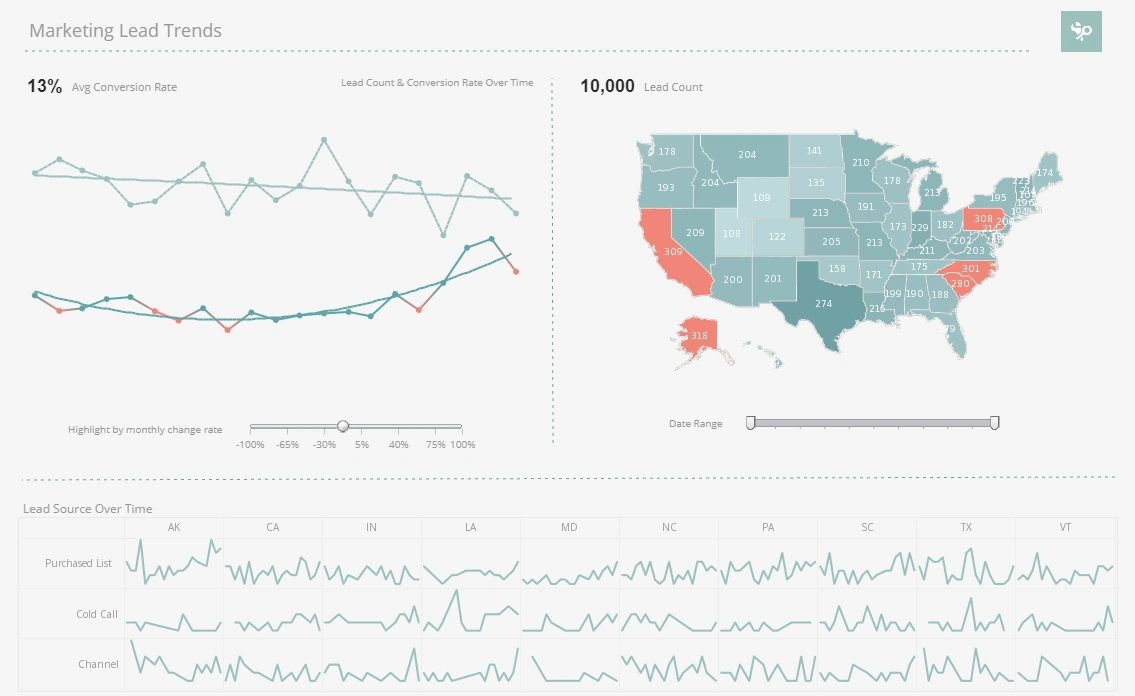
These fully dynamic displays are capable of reporting detail on any and all aspects of a business, if that is what the administrator desires. Dashboards are typically a collection of charts, selection lists, and graphs that are used to display a large amount of data in a condensed space. Using selection lists, along with a multitude of other elements, viewers of these dashboards can see detailed information in an instantly updating environment.

Reporting Tools in a Sales Environment
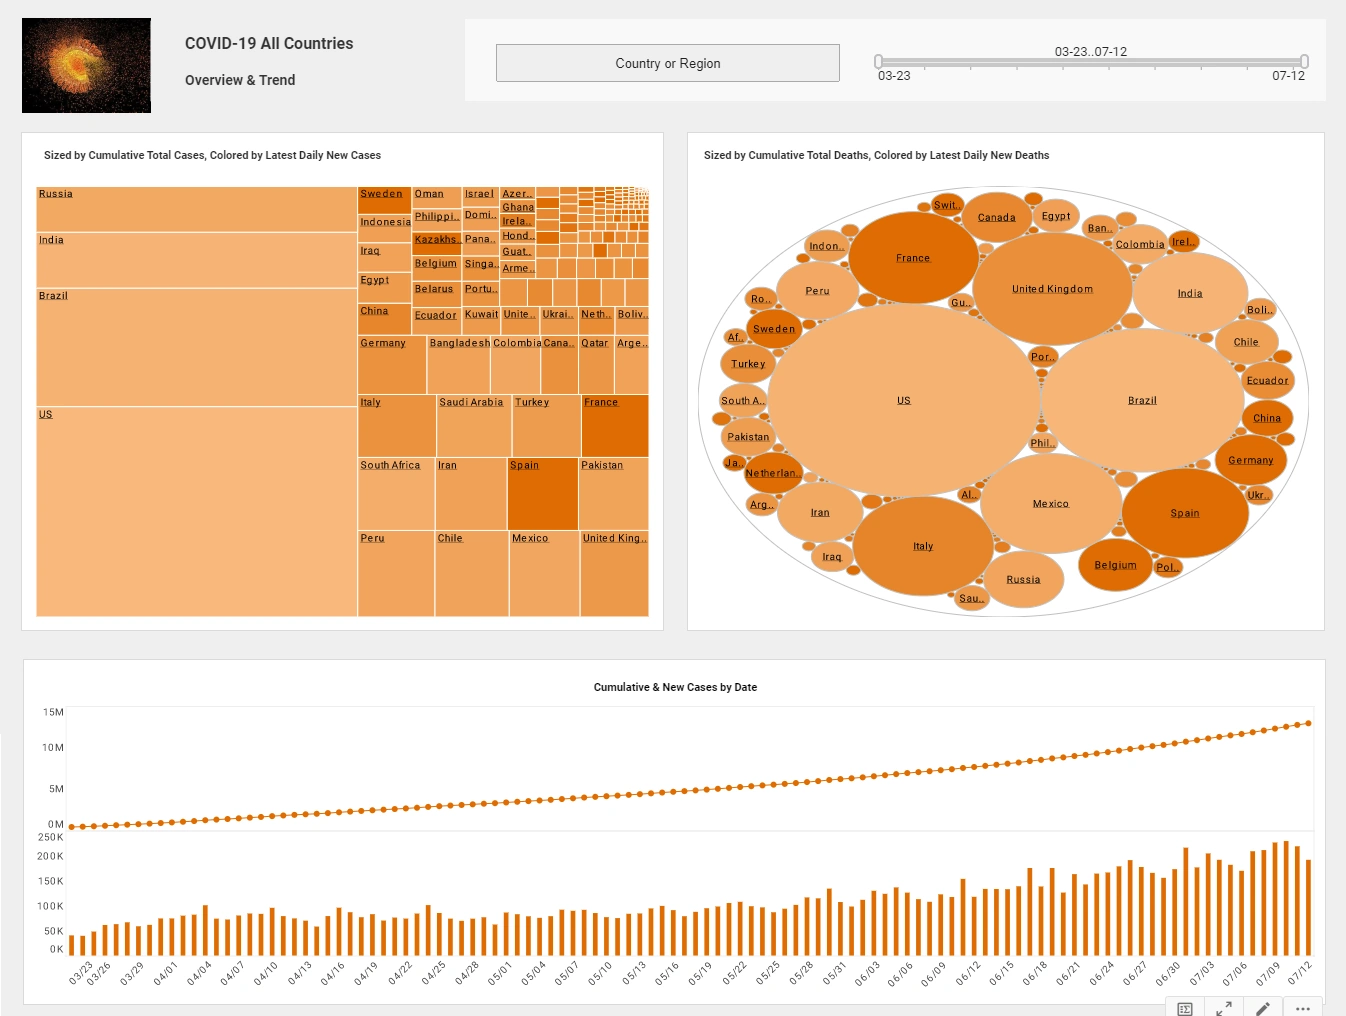
Dashboards
Using current data from almost any kind of database, users can create interactive data displays and reports for both analytical use and documentation. This can be especially useful in a sales oriented scenario.
Users can use StyleBI to track employee performance, products, inventory, sales, returns, and countless other sales-related metrics stored in a database. Using the aforementioned dashboards, this data is displayed dynamically where it can be filtered and sorted to show information relevant to the interests of the user. While the chosen database may contain millions of data-filled rows, a dashboard will only display that which the user deems necessary.
A good example is a dashboard designed to track employee performance. By default, this dashboard would contain an overview of all sales made by all employees. By manipulating the different elements present in a dashboard made in StyleBI, this information can be refined to show just the sales made by a certain salesperson between March of 2011 and today. This can be further distilled by region, state, or even product, depending on the user's preference and the administrator's permissions.
Alternatively, using a feature unique to StyleBI, brushing, users can highlight a specific data range in a chart, click a button, and watch as all the other elements of the dashboard update to reflect information pertinent to just that data range.
Reports
Reports are non-interactive data displays and thus cannot express as much information as efficiently as dashboards. In a report you may find it beneficial to focus on pre-filtered data. Reports are created using worksheets containing datablocks that query the database directly for user-defined information. Reports, like dashboards, update dynamically; that is to say that the data they display is up-to-the-minute, and not that they can be modified once they are generated.
Reports typically go into more detail than a dashboard. With InetSoft's BI solution, reports can actually be embedded directly into dashboards or other reports to create drill down data levels and tie information together.
Why InetSoft?
Deployment
Compared to other enterprise dashboard solutions, InetSoft's is easier to deploy and easier to use. Up and running in weeks, not months, you get the maximum levels of self-service via an intuitive, user-friendly interface. With easy point-and-click controls, little training is necessary, and individual sales people can customize their own view of just their deals.
Mobile Sales Intelligence
It's only half of a sales intelligence solution if people in the field can't use it. InetSoft's software platform supports any mobile device with a browser including iPhones and iPads, as well other phones and tablets.
Data Mashup
A key strength of InetSoft's business intelligence software is its depth of support for data mashups. The data pulled from your operational sales or CRM systems can be combined with almost any other data source found in your enterprise including: relational databases (JDBC), multidimensional databases, XML, SOAP, Java beans (POJO), EJB beans, flat files, Excel spreadsheets, OLAP cubes, and the proprietary data stores from salesforce.com, JDE, SAP, PeopleSoft, and Siebel CRM.
In addition, InetSoft has innovated unique capabilities for enterprise mashups. You do not have to be a BI analyst to create your own mashups. You can combine disparate tables and fields that were not previously mapped in a data model. Beyond that, you can also bring in your own data sets such as those in personal spreadsheets or those generated by vendors or partners. Whatever dashboards or reports you make from them are now shareable inside the enterprise BI space.

More Articles About Sales Reporting Tools
- Sample dashboards for manufacturing sales insights: Walks through combining CRM, order‑management, and social data into interactive sales dashboards, with charts like revenue trends, pipeline health, and opportunity discovery filters; includes step‑by‑step guidance for building tool‑tips, gauges, and scatter plots to uncover hidden insights.
- Explore interactive sales dashboard templates: Demonstrates self‑service filtering, bubble/bar/line charts, tool‑tips on hover and drill‑down interactivity designed to let sales managers dynamically explore revenue, pricing, returns and segmentation in real time.
- Insights into building sales KPI dashboards: Shows how to track metrics like revenue vs price, top product performance, lead count, close ratios and pipeline values using drag‑and‑drop analytics, enabling rapid creation of management dashboards.
- Overview of sales pipeline analytics tools: Describes how managers can monitor pipeline stages, spot stalled deals by stage duration, analyze stage‑by‑rep performance, and use automated alerts when opportunities exceed expected timelines.
- BI sales reporting tool guide: Highlights StyleBI’s support for tracking sales workforce activity against goals, calculating commissions, and visualizing performance trends using drag‑and‑drop visualizations and data mashup technology.
- How to analyze sales coverage and team productivity: Outlines KPIs such as conversion rates, sales velocity, deal size, geographic reach, demographic segmentation and team effectiveness—that collectively help increase revenue and optimize coverage.
- Review of PipelineDeals dashboard solution: Offers a look at prebuilt sales‑team dashboards for PipelineDeals, emphasizing clean visualization, fast deployment, self‑service features and mashup-driven insights for reps and managers.
- Guide on sales managers using analytics to hit targets: Describes how sales management can improve forecasting, penetration of accounts, channel performance and team planning through historical data, segmentation and predictive modeling.
- Unified sales and Salesforce dashboard solutions: Explains how sales dashboards can combine CRM, order management, call center and social media data into interactive analytics for opportunity discovery, forecasting, and cross‑sell insights.
- Trend analysis for sales forecasting and monitoring: Highlights charting product sales, average selling price or market share trends over time, and using scorecards with alert notifications to detect sales anomalies and trigger proactive actions.