Sales Management Application
Are you looking to better manage your sales team? Using a sales management application based on InetSoft's BI platform can help. No BI developer on staff is required. InetSoft provides mentoring and a package of support hours included for all new customers.


The Building Blocks of BI Technology
InetSoft's real-time DataBlock patented technology places the power of advanced data manipulation and mashup in the hands of non technical users, allowing the user to massage their data with a drag and drop interface, and save the resulting data mashups, to be used in dashboards, enterprise reporting, and scorecards.
More than 50% of business BI users are not satisfied with their information application, due to lack of resources to build and maintain the systems and those systems slowing down, resulting in BI and analytics problems. InetSoft is dedicated to correcting common data management challenges with an open standards software complete with data grid caching, for high performance speeds on even the largest of data sources. The increased speed of answered queries allows savvier business decisions to be made.
InetSoft's Capabilities
InetSoft's BI application is easy enough to be:
Agile Enough to be:
And Robust Enough to:
Acclaimed | Accurate | Interactivity
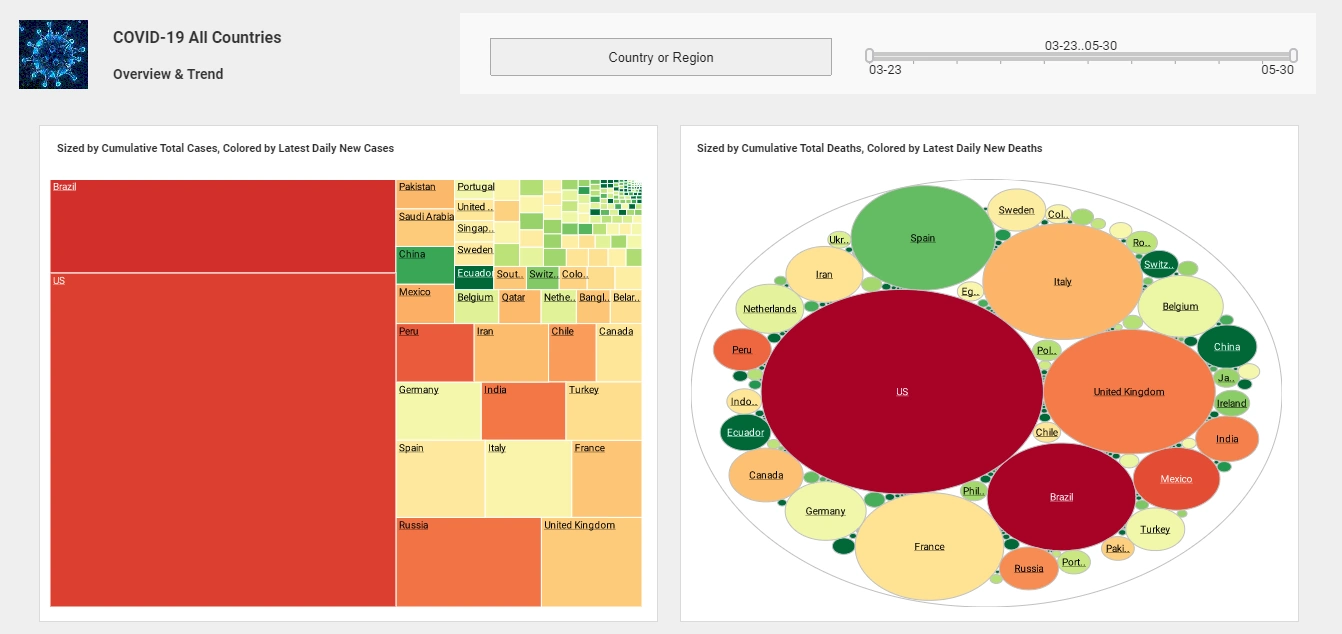
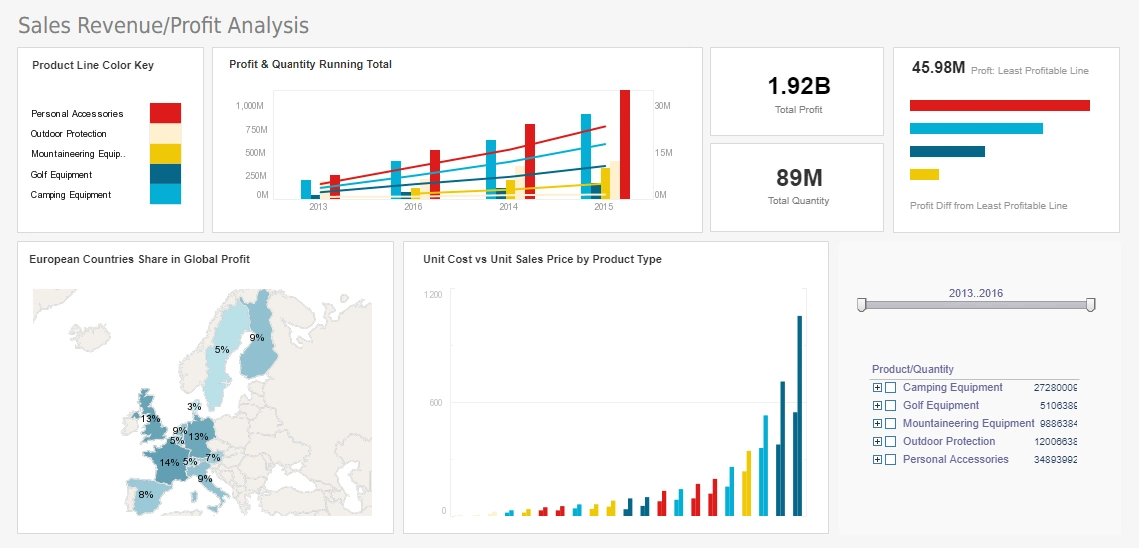
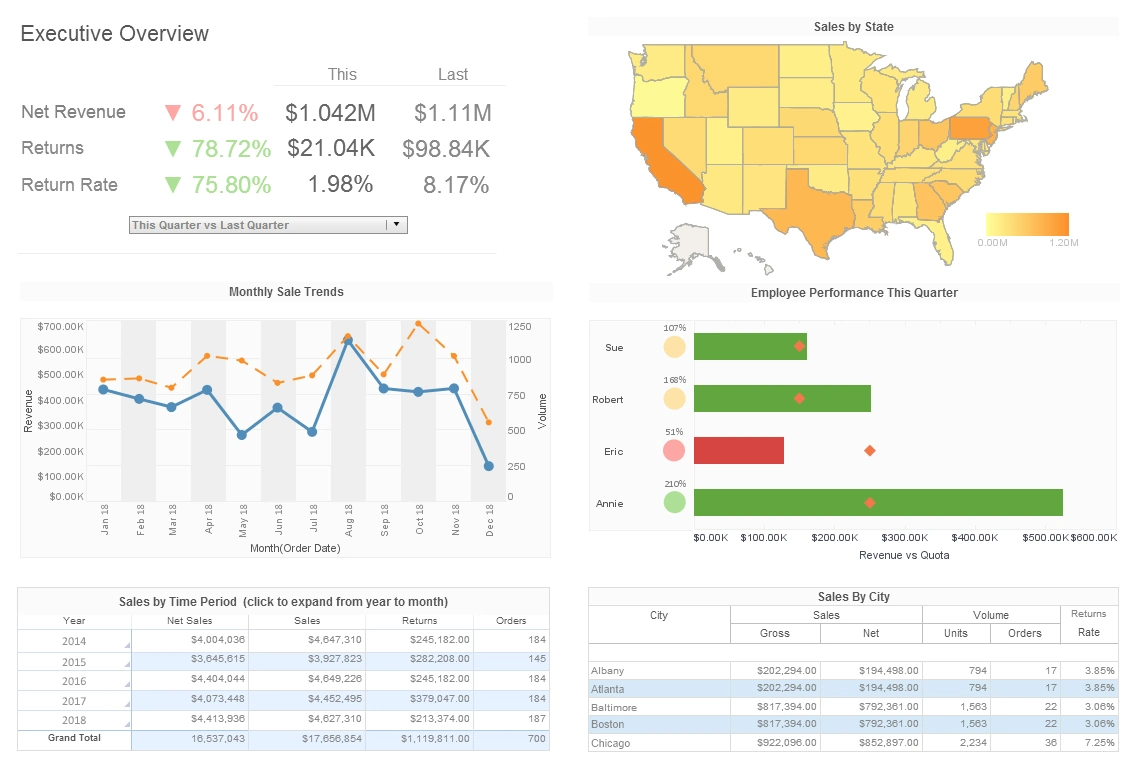
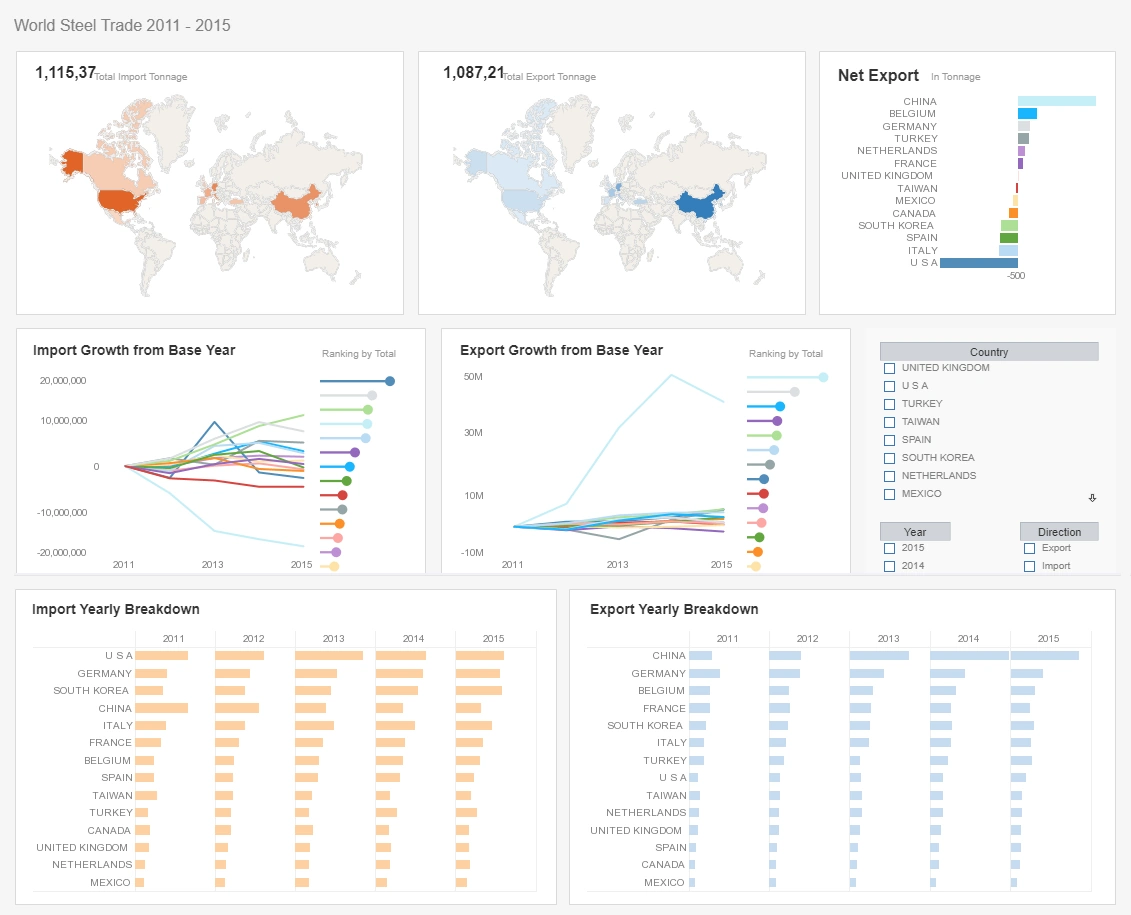
While the sales management dashboards above give insight into one of the many challenges in sales management, it is also a great example of how the management of a lot of different processes makes gathering all the right information crucial. If you don't have all the right information, then the planning suffers. As you may take notice in the example of the information provided, essential metrics include revenue segmented by product type and year.
The consolidation of so much vital information lends itself to the defining of benchmarks, resulting in proper planning. Read the datasheet linked below to get a better idea of how InetSoft's StyleBI can help you manage your sales and product teams more effectively.

How Would a Sales Manager Find Opportunities That Are Stuck in the Pipeline?
A sales manager's ability to identify opportunities that are stuck in the pipeline is crucial for maintaining a healthy sales process and ensuring that revenue targets are met. Identifying and addressing these stalled opportunities can help streamline the sales process, improve forecast accuracy, and ultimately drive sales success. Here are some strategies a sales manager can employ to find opportunities that are stuck in the pipeline:
1. Utilizing Sales Pipeline Analytics
Overview: Sales pipeline analytics tools provide a comprehensive view of the entire sales pipeline, highlighting where opportunities are in the sales process. These tools can show which deals have been in a particular stage for too long, indicating they may be stuck.
Key Actions:
- Monitor Stage Duration: Use analytics to track the average duration opportunities spend in each stage of the pipeline. Identify any deals that significantly exceed this average.
- Identify Bottlenecks: Analyze stages where opportunities commonly get stuck and look for patterns or common factors that may be causing delays.
2. Implementing Sales Automation Tools
Overview: Sales automation tools can streamline and automate various aspects of the sales process, including follow-ups, reminders, and task assignments. These tools ensure that opportunities are consistently moved forward through the pipeline.
Key Actions:
- Automated Alerts: Set up automated alerts to notify sales reps and managers when an opportunity has been in a stage for too long.
- Task Automation: Automate tasks such as follow-up emails, meeting requests, and updates to ensure that no opportunity is neglected.
3. Regular Pipeline Reviews
Overview: Conducting regular pipeline reviews with the sales team is essential for identifying and addressing stuck opportunities. These reviews provide a forum for discussing each deal, understanding challenges, and planning next steps.
Key Actions:
- Weekly Meetings: Hold weekly pipeline review meetings to go through each opportunity in the pipeline, focusing on those that have not moved recently.
- Collaborative Problem-Solving: Encourage the team to discuss challenges and brainstorm solutions for moving stalled deals forward.
4. Analyzing CRM Data
Overview: A well-maintained Customer Relationship Management (CRM) system is a valuable resource for tracking the status of opportunities and identifying those that are stuck. By analyzing CRM data, sales managers can gain insights into the reasons behind stalled deals.
Key Actions:
- Activity Tracking: Use CRM to track all interactions and activities related to each opportunity. Look for gaps in communication or follow-up that may indicate why a deal is stalled.
- Deal Age Analysis: Analyze the age of deals in the pipeline and compare them to the average sales cycle length. Deals that exceed this length may require attention.
5. Segmentation and Prioritization
Overview: Segmenting and prioritizing opportunities based on factors such as deal size, stage, and potential revenue can help sales managers focus on the most critical deals. This approach ensures that high-value opportunities receive the necessary attention to move forward.
Key Actions:
- Segment Opportunities: Divide the pipeline into segments based on criteria such as deal value, stage, and priority. Focus on high-value deals that are stuck.
- Prioritize Efforts: Allocate resources and efforts to prioritize moving high-value opportunities forward, ensuring they receive the necessary attention and follow-up.
6. Engaging with the Sales Team
Overview: Direct engagement with the sales team is vital for understanding the challenges they face with specific opportunities. Sales managers should regularly check in with their team to discuss stuck deals and provide support.
Key Actions:
- One-on-One Meetings: Conduct regular one-on-one meetings with sales reps to discuss their pipeline, focusing on stuck opportunities.
- Provide Support: Offer guidance, resources, and support to help sales reps overcome obstacles and move deals forward.

How Would a Sales Manager Find Which Reps Have the Fastest and Slowest Sales Cycles?
Identifying which sales representatives have the fastest and slowest sales cycles is essential for understanding individual performance, optimizing sales strategies, and providing targeted coaching and support where needed. Here are several effective methods that a sales manager can use to determine the speed of sales cycles among their team:
1. Review CRM Data and Sales Metrics
Overview: CRM (Customer Relationship Management) systems are invaluable for tracking sales activities, stages, and timelines. They provide a comprehensive view of each sales cycle from initial contact to deal closure. Here's how a sales manager can leverage CRM data:
-
Stage Duration Analysis: Utilize the CRM to analyze the average time opportunities spend in each stage of the sales pipeline for each sales representative. Compare these durations across the team to identify reps with faster or slower cycles.
-
Sales Cycle Length: Calculate the overall length of sales cycles for individual reps by analyzing historical data within the CRM. Look at metrics such as average days from opportunity creation to close, or average number of interactions before closing a deal.
2. Pipeline and Opportunity Reviews
Overview: Regularly reviewing the sales pipeline and individual opportunities provides insights into the progression and duration of sales cycles. This approach involves:
-
Pipeline Review Meetings: Conduct weekly or bi-weekly meetings to discuss the status of each opportunity in the pipeline. Focus on understanding where each rep's opportunities are in terms of progression and time spent in each stage.
-
Opportunity Aging Analysis: Identify opportunities that have been in the pipeline for an extended period. Compare the aging of opportunities across different reps to pinpoint who might be experiencing longer sales cycles.
3. Sales Activity Monitoring
Overview: Monitoring sales activities and engagement levels can indicate the efficiency and speed of sales cycles. Here's how to approach it:
-
Activity Metrics: Track key sales activities such as calls made, emails sent, meetings scheduled, and demos conducted by each rep. Compare the frequency and intensity of these activities to understand how they correlate with the speed of closing deals.
-
Response Times: Measure the average response time to leads and customer inquiries. Faster response times typically indicate a more proactive approach that can accelerate sales cycles.
4. Conversion Rates and Win/Loss Analysis
Overview: Analyzing conversion rates and win/loss ratios provides insights into the effectiveness and efficiency of each sales rep's approach:
-
Conversion Rate Analysis: Calculate conversion rates for each sales rep by comparing the number of opportunities closed successfully against the total number of opportunities pursued. Higher conversion rates often correlate with shorter sales cycles.
-
Win/Loss Analysis: Examine the reasons behind won and lost opportunities. Evaluate whether longer sales cycles correlate with specific reasons for lost deals, such as competition, pricing issues, or customer objections.
5. Feedback and Performance Reviews
Overview: Regular feedback sessions and performance reviews provide opportunities to discuss individual sales strategies, challenges, and improvement areas:
-
Coaching Sessions: Conduct one-on-one coaching sessions to discuss sales performance metrics, including sales cycle duration. Provide constructive feedback and identify areas where reps can improve efficiency.
-
Goal Setting: Set realistic and achievable goals for shortening sales cycles based on individual performance data. Monitor progress regularly and adjust strategies as needed to meet objectives.

More Articles About Sales Reporting
Evaluate InetSoft's Sales Reporting Tool vs. Tableau - Is Tableau a reporting tool? No, it does not offer paginated, highly formatted reporting like InetSoft does. Other advanced production reporting features include: bursting, embedded business logic, and reusable components. As a pioneer in reporting, InetSoft later added dashboarding and advanced data visualization. View a demo and try interactive examples...
Examples of Sales Dashboard Interactivity - In this sales dashboard example we see some interactive drilling techniques exposéd. Active in this screen shot are the slider date restrictions, also the search function has been utilized to pinpoint a specific type of customer, allowing the data to be restricted to the customers selected. Also, the sales team selection list has been used to focus on the performance of one sales team specifically...
Reporting Tools in a Sales Environment - Using current data from almost any kind of database, users can create interactive data displays and reports for both analytical use and documentation. This can be especially useful in a sales oriented scenario. Users can use StyleBI to track employee performance, products, inventory, sales, returns, and countless other sales-related metrics stored in a database. Using the aforementioned dashboards, this data is displayed dynamically where it can be filtered and sorted to show information relevant to the interests of the user...
Webinar About Sales Team Reporting - I was just hoping may be you could expand a little bit on your ability to do sales team reporting, being able to report on the performance of individual members of the sales team and some of the different ways that you might be able to represent their performance graphically? What you already mentioned was really interesting here so I just thought that maybe you could give us an overview of what would be available in that regard...