| #1 Ranking: Read how InetSoft was rated #1 for user adoption in G2's user survey-based index |
|
Read More |
The code samples below illustrates how the application can be controlled with a JavaScript-like API.
LinearSizeFrame
The LinearSizeFrame object contains a frame that linearly maps numerical data values to sizes. To create a LinearSizeFrame object, call the LinearSizeFrame constructor.
 importPackage(inetsoft.graph.aesthetic);
 var frame = new LinearSizeFrame('Quantity');
You can pass the name of a field (e.g., 'Quantity') to the constructor, or specify this later using the inherited VisualFrame.setField(field) property.
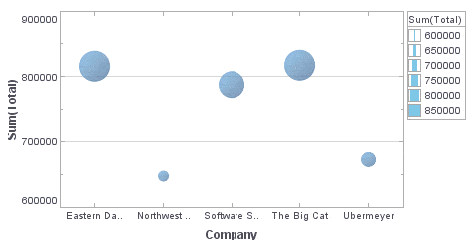
Example (Report)
Bind a point-type chart to the sample 'All Sales' query, with 'Company' (top 5) on the X-axis, and Sum(Total) on the Y-axis. Add the following script in the onLoad Handler.
importPackage(inetsoft.graph.aesthetic);
Graph1.bindingInfo.setSizeField("Total",Chart.NUMBER)
Graph1.bindingInfo.sizeFrame = new LinearSizeFrame;
Example (Report or Viewsheet)
importPackage(inetsoft.graph)
importPackage(inetsoft.graph.element)
importPackage(inetsoft.graph.scale)
importPackage(inetsoft.graph.aesthetic)
importPackage(inetsoft.graph.data)

var arr = [["State", "Quantity", "width"], ["NJ", 200, 5],
           ["NY", 300,10], ["PA",75,15]];
dataset = new DefaultDataSet(arr);
graph = new EGraph();
var elem = new IntervalElement("State", "Quantity");
var frame = new LinearSizeFrame();
frame.setField("width");
frame.setSmallest(10);
frame.setLargest(50);
frame.setMax(100);
elem.setSizeFrame(frame);
graph.addElement(elem);
 |
“We evaluated many reporting vendors and were most impressed at the speed with which the proof of concept could be developed. We found InetSoft to be the best option to meet our business requirements and integrate with our own technology.”
- John White, Senior Director, Information Technology at Livingston International |
CategoricalSizeFrame
The CategoricalSizeFrame object contains a frame that assigns a unique size to each distinct value. To create a CategoricalSizeFrame object, call the CategoricalSizeFrame constructor.
 importPackage(inetsoft.graph.aesthetic);
 var frame = new CategoricalSizeFrame('State');
Example (Report)
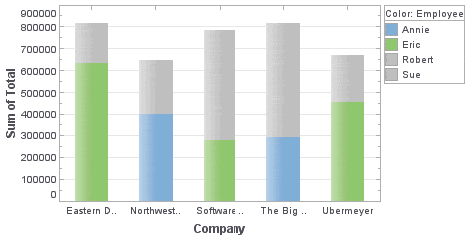
Bind a point-type chart to the sample 'All Sales' query, with 'Company' (top 5) on the X-axis, and Sum(Total) on the Y-axis. Add the following script in the onLoad Handler.
importPackage(inetsoft.graph.aesthetic);
Graph1.bindingInfo.setSizeField("Employee",Chart.STRING)
Graph1.bindingInfo.sizeFrame = new CategoricalSizeFrame;
Example (Viewsheet or Report)
importPackage(inetsoft.graph)
importPackage(inetsoft.graph.element)
importPackage(inetsoft.graph.scale)
importPackage(inetsoft.graph.aesthetic)
importPackage(inetsoft.graph.data)
var arr = [["State", "Quantity"], ["NJ", 200],
           ["NY", 300], ["PA", 75]];

dataset = new DefaultDataSet(arr);
graph = new EGraph();
var elem = new IntervalElement("State", "Quantity");
var frame = new CategoricalSizeFrame();
frame.setField("State");
elem.setSizeFrame(frame);
graph.addElement(elem);
CategoricalSizeFrame.setSize(val,size)
Assigns a size to the specified value.
Parameter
val
 a data value size size at which to represent data value
Example (Report)
Bind a point-type chart to the sample 'All Sales' query, with 'Company' (top 5) on the X-axis, and Sum(Total) on the Y-axis. Add the following script in the onLoad Handler.
importPackage(inetsoft.graph.aesthetic);
Graph1.bindingInfo.setSizeField("Employee",Chart.STRING)
Graph1.bindingInfo.sizeFrame = new CategoricalSizeFrame;
Graph1.bindingInfo.sizeFrame.setSize('Robert',20);
Graph1.bindingInfo.sizeFrame.setSize('Eric',20)
Graph1.bindingInfo.sizeFrame.setSize('Sue',5);
Graph1.bindingInfo.sizeFrame.setSize('Annie',5);
Example (Report or Viewsheet)
importPackage(inetsoft.graph)
importPackage(inetsoft.graph.element)
importPackage(inetsoft.graph.scale)
importPackage(inetsoft.graph.aesthetic)
importPackage(inetsoft.graph.data)

var arr = [["State", "Quantity"], ["NJ", 200],
           ["NY", 300], ["PA", 75]];
dataset = new DefaultDataSet(arr);
graph = new EGraph();
var elem = new IntervalElement("State", "Quantity")
var frame = new CategoricalSizeFrame();
frame.setField("State");
frame.setSize('NJ',5);
frame.setSize('NY',10);
frame.setSize('PA',20);
elem.setSizeFrame(frame);
graph.addElement(elem);