InetSoft Product Information: Data Mashup Software
This is a table of contents of useful information about InetSoft's data mashup software which is included in its business intelligence application for dashboards, reporting, and analytics, Style Intelligence:
Example of Data Science Applied to Healthcare - Abhishek: How about an example of data science applied to healthcare? Do we have an opportunity to look to beyond the technology into an actual use case? You probably can't name them, but where and how is this being used, and what are the paybacks? Jim: So, we work in large, whether that'd be private or public, and we will deal with something in the size of a Medicaid program for a state. So when you imagine the population of a state and the number of people involved in a healthcare program of that size, we have to analyze the entire program and all the claims and recipients and providers in that healthcare program. So that data is really large. Abhishek: So provide an example perhaps as to what was the case before and then after applying your data science solution to the problem. Jim: So the biggest challenge that most of them face is which I alluded to earlier is that they don't need to go out and figure out in this big data set of claims what do I have to do today to actually help solve the problem of doing recruitments or teaching people how to bill more properly, or getting rid of waste or abuse, or asking for money back, or changing policy so that people stop paying for things that shouldn't be paid for...
 |
Click this screenshot to view a two-minute demo and get an overview of what InetSoft’s BI dashboard reporting software, Style Intelligence, can do and how easy it is to use. |


Example of Using Python to Extract Data from MySQL - There are several libraries in Python that can be used to interact with a MySQL database and extract data from it, such as: MySQLdb: This is a python driver for connecting to a MySQL database. It's an implementation of the Python Database API Specification v2.0. PyMySQL: This is a pure Python MySQL client library. It is compatible with python versions from 2.7 to 3.x. SQLAlchemy: This is a powerful and flexible Object-Relational Mapping (ORM) library that allows you to interact with databases in a pythonic way. To extract data from a MySQL database using these libraries, you'll typically need to: Connect to the database using the appropriate library and credentials (e.g., host, user, password) Create a cursor object to execute SQL queries Use the cursor object to execute SELECT statements and retrieve the results Iterate through the results and process them as needed Close the cursor and the connection to the database when you're done Here is an example of how you could extract data from a MySQL database using the PyMySQL library...
 |
Read how InetSoft saves money and resources with deployment flexibility. |
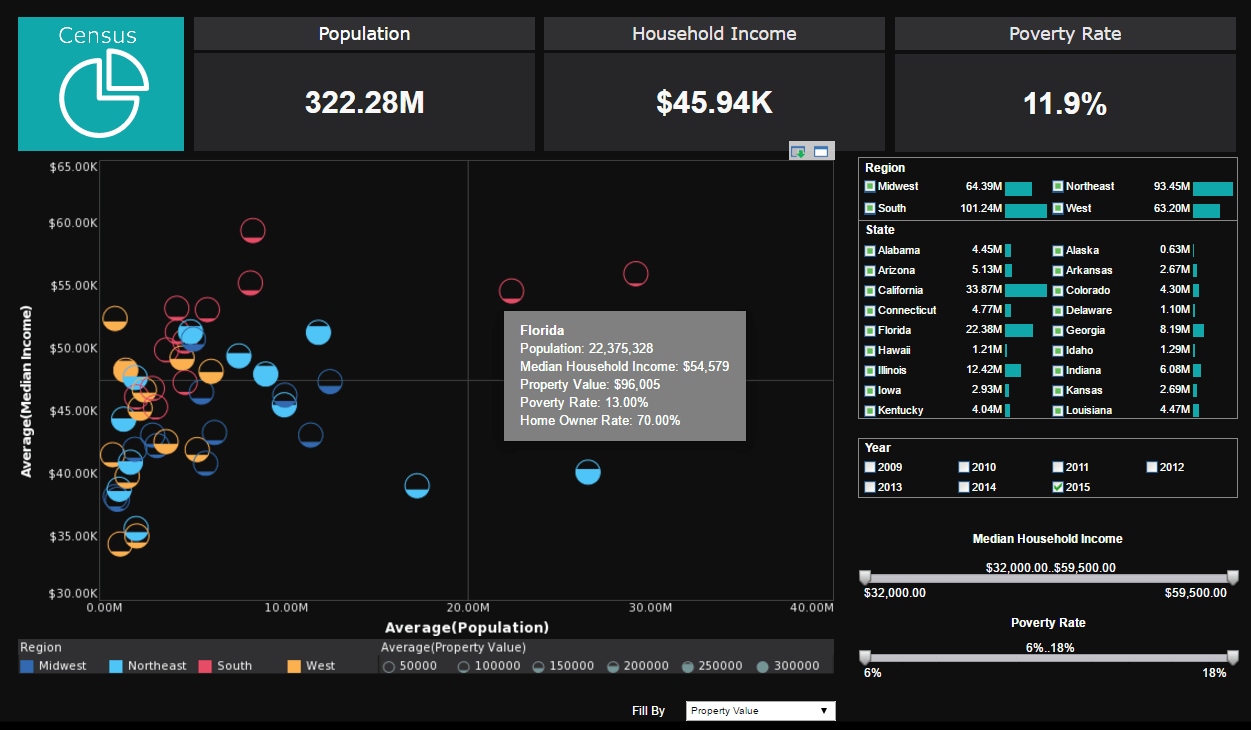
Example of Visual Analysis of a Multi-dimensional Data Set - I am suprised by how much interactivity there is this visualization dashboard. But I am wondering how do the slider bars work? Byron Igoe (BI): For instance in this little simple example of visual analysis of a multi-dimensional data set provided by the US Census Department, the slider is usually bound to your numeric data. Here you have got some sliders for these different pieces of census information. Question: Now are you able to implement a slider because you have got the data running in a cache or separate in-memory database? BI: So here is actually a pretty major technological differentiator from other BI solutions. Everything that we do is server-side. Whereas a lot of the other web-based dashboard products out there, it's basically a one-time compilation and one-time building of a SWF that then gets downloaded, a different SWF for each dashboard...
Examples of Data Mashups - I am going to just pick a couple of examples of data mashups and then go little bit deeper. The first one is an example of classic reporting, a daily sales report across multiple drugs for a biotechnology company. Part of that information comes from a Oracle database that has the North American sales and also the budget, but the problem is there are a lot of other inputs to the system coming from external wholesalers and distributors across 90 countries. So if you want to have a real time view then you needed to have a virtualization layer that has these data sources normalized and is basically accessing those information sources on demand to provide the real time views. Now it is easy to consolidate that data into a daily sales report that may be exposed as an executive dashboard. Now this doesn’t preclude that combination from also going back, in this case it’s shown as another database, but in effect going back to a data warehouse for our future or historical analytics. And in this process, data virtualization is accessing and converting semi-structured data providing a faster way to transform, match and integrate this as opposed to ETL’ing all of this, which would then introduce latency...
Executive Support for Enterprise Data Warehouse Initiatives - Let’s talk a little today about the need to gain executive support for enterprise data warehouse initiatives and business intelligence initiatives. Why is that such a critical step? What's really happening in the use of business intelligence and data warehousing is a change to the business process. It's not just the implementation of technology by itself. And when you change a business process, technologists don’t really do that, business managers do that. It’s very important that you have executive support, not just financially but the active involvement of executives. And in gaining that support, it also allows you to truly understand, measure and communicate the impact and the benefits of what they have agreed to do, the technologists agreed to do and the business process users either internally or externally are changing. Much of what goes on really in this business intelligence effort, in essence, in a company is not technology. It's change management...
Evolving a Rationalized Set of Canonical Data Models - The effect here is that, because we haven’t developed our environment 30 years earlier in anticipation of many different ways that the business was going to grow and change, we ended up with this complexity and variation. But once we have an understanding that those things can exist, we want to reduce the risk of doing the same things over and over again - replicated functionality, replicated work, rework by understanding where those differences are. We can start to migrate towards a more standard environment so we can assess the variances. We can look at what types of data standards we can use for bubbling up that chain of definition from the business term to the data element concepts to the uses of the data elements, the conceptual domains and the value domains...
Facts about AI that Everyone Needs to Know - Artificial Intelligence is a concept of science which is rapidly expanding. It can be an interesting topic for science trivia challenges and science projects by students. In basic language, artificial intelligence is the ability of a machine to learn and perform a specific task. Scientists are intrigued by the fascinating results by auto driving cars or the Siri application in our mobile phones. They are striving continuously to advance in this field. The ultimate goal is to produce effective systems to perform trivial jobs and activities which take a lot of human efforts. Applications of artificial intelligence range widely from the banking and finance sector to medical care, information technology, agriculture, and even human resource management. Data scientists create algorithms and predictive analysis of the behavior of machines. They install a set of instructions to perform specific tasks. As the machine is programmed and strictly goes by the logic of algorithms, there is little to no chance of any mistakes. That's why AI is used for the safety and security facilities for facial recognition. The ultimate goal of scientists is to provide AI systems with problem-solving and decision making capability. Although the dream is far from reality, people are still afraid that AI robots might take over the world or individuals will be unemployed in the future because a robot replaced them...
 |
“Flexible product with great training and support. The product has been very useful for quickly creating dashboards and data views. Support and training has always been available to us and quick to respond.
- George R, Information Technology Specialist at Sonepar USA
|
Features of the Visual Query Builder - Features of the Visual Query Builder InetSoft's Visual Query Builder typically offers the following features: Drag-and-Drop Interface: The tool provides an intuitive, user-friendly interface where users can drag and drop database tables and fields to visually construct their queries. This eliminates the need for users to have in-depth knowledge of SQL syntax. Query Building: Users can build complex queries by selecting fields, specifying filtering conditions, sorting criteria, and defining relationships between tables using visual elements. This allows users to create intricate queries without writing code. Joining Tables: The tool often supports various types of table joins, like inner joins, outer joins, and cross joins. Users can visually establish relationships between tables and define how they are connected. Filtering and Sorting: Users can apply filters to narrow down the data retrieved from the database. Additionally, sorting options can be easily applied to arrange the data in the desired order...
Financial Institutions Can Use Big Data to Improve Operations - Big data has entered the mainstream and businesses from a wide variety of industries have attempted to reap the benefits that come from data integration and analytics. Financial institutions have evolved to use big data in almost every aspect of their business, from customer service to business intelligence, but some business leaders are unsure of how they can build the right data foundations to extract the maximum value from their big data projects. Here are some ways in which financial institutions are using modern data practices to improve operations and some tips for financial institutions who wish to begin doing the same...
First Step in a Data Virtualization Process - That’s the first step in a data virtualization process, to create this normalized or base model disparate data. The second step is to transform it, improve its quality and integrate it into new data models. The third step is to expose this information through as a virtual relational database or as a Web service, such as an XML feed, or something that can be accessed as a Java Object or as a Java Portlet or as a SharePoint Web Part. The reason you want to do that is so you have reusability of these data models to serve multiple applications. You are basically providing virtualized access. Now in runtime, any external application would call the dashboard or report created in this data mashup platform. The platform would understand the query, optimize it and may decide automatically or in design time whether to pull real-time or cached data, in which case a scheduler is invoked to pre-fetch the data. You are not doing a full-blown replication of a data store. You are only selectively using caches or a scheduler to complement virtualization...
Flat File Dashboards and Excel Dashboard Analytics - Able to access almost any open standards data source (such as POJO and others), InetSoft's BI server can also access Excel spreadsheets, (file extensions .xls) or other flat files like .csv (comma separated value) and XML files. Excel is great for KPI calculations and serves as an easy ad hoc database for many departments. They can drive weekly or even daily performance management reporting from PowerPoint slides or macro-driven workbooks. But when you're ready to graduate to a proper Web-based dashboard platform with security-controlled shareability and accessibility from almost any device anywhere, then InetSoft's BI application can meet that need. Or you may have a custom-built application, a Web service, or a system that does have open-standards based connectivity to its data store, and all you have are .csv or XML files and need to have simple or advanced dashboards and reporting. For InetSoft's BI application, connecting to a .csv file is the same as connecting to a spreadsheet. And with XML file, you can leverage the InetSoft API to build a custom connector to read your XML tags...
Flexible Data Access Framework - Speed really isn’t the essential element to realizing the value of the information and access to it. It’s key to remove those critical blind spots that lead to lack of timely information. So really what an IT organization needs to deploy is a simple, flexible, data access framework for getting at new sources of information and bringing them on board. They need to able to do so in a way that frees them from the boundaries of the traditional date warehouse, things that are more either schema less or flexible schema platforms. Also it’s important to have simplified technology stacks, fewer moving parts, less pieces that need to be updated when you have to make changes. And ultimately all these elements combine to allow organizations to acquire new data sources and bring in new information in hours instead of days or weeks. Look back at the legacy technology deployments. If you have make a change, they require you to adjust ETL processes and change your data warehouse schema, refresh your data mart or build a new data cube. They put you at a disadvantage. You’re weeks behind where you can be with agile BI and unified information access type of systems. The final point is building on the theme of unified information accesses, speed is very important, but it’s also important to bring that speed to the full breadth of data sources, unstructured and structured, as well...
 |
View a 2-minute demonstration of InetSoft's easy, agile, and robust BI software. |
Focus on Big Data by BI Vendors - There is a lot of focus on Big Data by BI vendors. So we’ll talk about how to achieve new possibilities by innovating your big data analytics. What does it mean to innovate? What does it mean to think about tomorrow? How could turn your business in a Big Data business? Let’s just say it was the Big Data Manufacturing Company or Big Data Healthcare. What will that mean to you? How do you engrain insights into your people and processes? How do you create a culture that actually uses information no matter who you are in the business? It might get talked a lot about, the fact that every individual needs different types of analytics, and getting the right information to each one of those individuals at the right time whether it's daily or hourly or weekly is the goal. How do you run a real time enterprise, and when we say a real time enterprise we don’t mean in up to the sub second enterprise because that’s not what you mean. We mean an enterprise that is state-of-the-art, that is up to date, that is meeting customer needs, that is real time when it comes to making decisions...
For a Successful MDM Project - For a successful MDM project, it's important for the business side to be involved in the project in terms of setting goals and expectations. Some organizations are formally doing this collaboration through Centers of Excellence, Competency Centers and Advisory Councils, just to give a few of the names that these groups of champions and evangelists who regularly meet to review an MDM project are called. So we find that many organizations will start with this approach and try to get kind of an organizational or political kind of body together and then look for good reference data sources around the organization where data is managed well and begin to work MDM through a few related sources before trying to expand into an enterprise initiative. I should say that we have done some research in this area and 36%, according to one of our research studies, do have projects in place to be deployed across the enterprise, and another 44% said they started corporate projects in certain business functions or divisions but do envision rolling it out as an enterprise implementation...
 |
Click this screenshot to view a three-minute demo and get an overview of what InetSoft’s BI dashboard reporting software, Style Intelligence, can do and how easy it is to use. |
Formula Tables - Formula tables are used to create real-time, spreadsheet-like reports with highly specific or complex layouts. These tables can be used to implement the kind of data grouping and aggregation which is commonly required in accounting and financial applications. Formula tables bridge the gap between spreadsheet applications (like Excel) and traditional reporting tools. In a spreadsheet, you usually 'fill' a column with data and then define summary formulas that reference different cells. A formula table is similar. Rather than bind the table to a query as a whole, you extract parts of a query result set and then dynamically fill the header rows and header columns of the table. You can then reference these 'filled-in' cells to perform statistical calculations in formulas...
Fusebill Subscription Dashboard - If you use Fusebill and are looking to go beyond the in product reports, consider Inetsoft's Style Intelligence and it's new custom Fusebill connector. Now you can integrate Fusebill billing and subscription data with budgeting, performance and product management, and any other relevant data source...
Getting a Representative View of the Chain of Information - Here is a good example. I was once talking in front of an audience consisting of technology providers, actually software companies, and they said, very often what we will do is we will provide evaluation licenses of our software to prospective customers and we give them 30 days worth of customer service. Well, as far as the sales people are concerned, they are still prospects, they are not customers because they haven’t obliged by the rule of the definition of customer which is giving the company money in exchange for the use of a product. On the other hand, as far as the customer service department was concerned, those individuals were just as customers as anybody else who shared their money with company, because they were under the licensed evaluation agreement, they were provided full customer service or full customer support...
Goals in Operational Application Development - So if we just look at some of the goals in operational application development, they came up with the word agile. They just wouldn’t be more nimble in their work. And in a lot of ways agile is the wrong word. I think what we are all looking for is just to speed things up. And a lot of times, also with methodologies, lot of times people say, well you know the method is great, but I am a business man or woman. I don’t really care what the guys in the cubes do as long as they crank it out. Well, actually you should care especially in business intelligence because what the men and women are doing in the cubes takes a long time. And I mean we have all heard the classic complaint: ‘I just want a new report,’ or even simpler, ‘I just want a revision of an existing report, and it took six weeks for me to even get a response and another six weeks for kind of a review, a third six weeks for approval; six months out I am still waiting for this report.’ Where did it come from? And it’s no joke. The pace of business just accelerates so it’s really a need for the business people to get the products of business intelligence sooner to them because with the pace of business, especially where the recession drove all kinds of changes, even the recovery is driving changes because companies are trying to realign to the new reality, the new economy...
Good Big Data Solution -InetSoft's Style Intelligence is a BI solution that makes a perfect complement to any Big Data source. With a range of add-ons including a recently added Hadoop connector, InetSoft's solution has the ability to pull data from any major Big Data source, as well as a host of other data sources. The robust data mashup engine can pull data from these disparate sources and combine them with sophisticated data modeling in order to create a unified source of actionable information...
| #1 Ranking: Read how InetSoft was rated #1 for user adoption in G2's user survey-based index |
|
Read More |
Good Data Discovery Tools - Are you searching for a good data discovery tool? InetSoft offers an easy to deploy, easy to use enterprise data visualization and dashboarding application...
Good Data Mining Tool - Any good data mining tool has to have some text analytic capabilities built into it. They basically extract additional signals that can be used for more traditional structure analysis. The second point I want to make is about looking at new paths of inquiry. Beyond being able to get additional signals from unstructured text, it provides an opportunity to look at data along different dimensions. There are dimensions that weren’t necessarily intended by the data architect or the organization setting up the infrastructure for end users. And we find that keyword search is really one of the best ways to effectively slice new dimensions through your data and uncover new linkages and new correlations. So for example you may be looking at the impact of media or news on sales performance. You are looking at social media, being able to look at trends around key topics within tweets and within news. It can allow for new trends to be surfaced and new correlations with sales performance to be seen. Dashboards are the kind of technology that really helps enable that sort of inquiry into a structured universe of analytics...
Good Strategy Data Mining - This podcast is about how to develop a good strategy for data mining. Data mining is not likely to be fruitful unless the data you want to use meets certain criteria. Today we will talk about some of the aspects of the data and its application that you should consider. Is the data available? This may seem like an obvious question, but be aware that although data might be available it may not be in the form that can be used easily. You can input data from databases, via ODBC from files. The data, however, might be held in some other form or in a machine that cannot be directly accessed. It will need to be downloaded or dumped in a suitable form before it can be used. It might be scattered among different databases and sources and need to be pulled together. It may not even be online, If it exists only on paper, data entry will be required before you can begin data mining. Does the data cover the relevant attributes? The object of data mining is to identify relevant attributes so this may seem like an odd question. It is very useful however to look at what data is available and to try to identify the likely relevant factors that are not recorded. In trying to predict ice cream sales, for example, you may have a lot of information about retail outlets and sales history, but you may not have temperature and weather which is likely to play a significant role...
Good Ways to Connect Data Marts - Data marts are essential for enabling departments to store data that is specific to their business needs. However, users often have to perform analyses which require information from the data marts of other departments....
Governed Data Integration - Data integration is a complex process that involves combining data from different sources into a single, unified view. This process is essential for many organizations to gain insights and make informed decisions. However, the process of data integration can also be quite challenging, especially when it comes to ensuring that the data being integrated is accurate, consistent, and secure. In recent years, there has been a growing emphasis on the concept of "governed" data integration. This refers to the use of specific policies and procedures to ensure that data integration is done in a controlled and systematic way. The goal of governed data integration is to ensure that the resulting data is accurate, consistent, and secure, while also complying with legal and regulatory requirements. While governed data integration may seem straightforward, it can actually be quite complex. There are many factors to consider, including data quality, security, and privacy. In addition, there may be legal or regulatory requirements that must be taken into account...
Graph Data Science - The study of intricate interconnections and interactions between data pieces is the focus of the quickly expanding area known as "graph data science." To make sense of massive, interconnected datasets, it makes use of graph databases, graph algorithms, and machine learning techniques. This article will examine what Graph Data Science is, how it functions, and the many sectors in which it is used. A branch of data science called data science focuses on the analysis of data presented as graphs. A graph is a type of mathematical structure made up of a set of nodes (also known as vertices) and a set of connecting edges. Each edge depicts a connection or relationship between two nodes. Numerous types of data, such as social networks, transportation networks, biological networks, and others, can be represented using graphs. To glean insights from such data, graph algorithms and machine learning methods are used in graph data science...
Great Success in Facilitating Data Exploration - Where we have seen great success with InetSoft is in facilitating data exploration. We talked about the rising self-service data prep tools. That has helped people be able to blend data for multiple sources where in the past they would've had to go through ETL work to the data warehouse, they are able to do that more on-the-fly, more agilely. So all of these technologies have grown because ultimately end users, business users have not been able to have their needs met in the waterfall model, and what we have seen with our customers and with those central BI teams, again be it in IT or in the business, they are facilitating a relationship where they are iterating and working together. Through a central model you have certified data sources and great visibility into what people are doing and lineage and impact analysis on changes in worksheets and things like that. But ultimately the people in the business are empowered to ask questions and answer the question. So that certainly is what we see and we expect Big Data just facilitates this even more because it's more types of data to answer all other types of questions. Holly and Larry, anything to add...
Hadoop and Business Discovery - We are hearing a lot about Hadoop and of course, before that we heard a lot about MapReduce, but Hadoop in particular is a very effective means for gleaning value from unstructured data. But there is a bit of a process that you have to work around. It’s not quite a straightforward as with traditional data warehousing. The Hadoop Technology (when it kind of entered the market a while back) created an awful lot of buzz and it has really great capabilities, but with that said working with the Hadoop open-source stack, it can be somewhat complicated it’s not quite as easy as advertised. And when you get vendors like InetSoft and others that have created ways to speak Hadoop stack and access that Big Data, they are really kind of solving some of the problems for you. And it’s certainly a trend that I have seen in the space that more and more of the innovative vendors are addressing the Hadoop stack in a way that’s kind of eliminating some of these scarier skill sets that might be required to get out that information and making it a lot simpler to utilize...
Hadoop Graphical and Report Tools - Looking for good hadoop graphical report tools? InetSoft's pioneering dashboard reporting application produces great-looking web-based dashboards visualizations for Hadoop environments with an easy-to-use drag-and-drop designer. View a demo and try interactive examples...
Healthcare Data Pipeline - A healthcare data pipeline serves as the backbone of modern healthcare analytics, enabling the seamless flow of data from various sources to its ultimate destination, where it can be leveraged for critical insights and decision-making. At its core, a healthcare data pipeline consists of a series of interconnected stages or processes designed to collect, ingest, transform, store, and analyze healthcare-related data. The pipeline typically begins with data acquisition, where information is gathered from disparate sources such as electronic health records (EHRs), medical devices, wearables, and patient portals. This initial stage requires robust mechanisms for data extraction and ingestion to ensure that data is efficiently collected and integrated into the pipeline...
Hierarchical Arrangement of Multidimensional Data - InetSoft's dashboard application allows hierarchical arrangement of multidimensional data and produces brilliant visualizations. View the example below to learn more about the Style Intelligence solution...
 |
Read what InetSoft customers and partners have said about their selection of Style Scope for their solution for dashboard reporting. |
High Speed Parallel Processing to Connect to Data - Yeah, I mean, definitely the area we are seeing that like a local audience around the appliance area, the people putting in very high speed parallel processing to connect to data very, very quickly, but I think the performance that you want to output certain data fast, and you want to put other data on systems that needs to process slower than others in terms of their size. And again the ability to bring all that data together and place things that you have to repair the data, I think what is going to emerge out of the next year in terms of the business, the purpose is where they have designed but targeting the user where they came. Where did they come from? Richard Walker: Yeah. It's a good point, and I am going to another hardware piece. Last week I was at Teradata Partners Conference, and I saw an appliance there from Teradata that has solid state drives in it. So we are all kind of waiting around to see if solid state was going to kind of replace memory. What about flash memory? Is that coming on in the enterprise systems, that kind of thing...
How Are OLAP and Data Warehouses used in Artificial Intelligence? - OLAP (Online Analytical Processing) and data warehouses play a significant role in the context of Artificial Intelligence (AI) by providing the necessary infrastructure and data processing capabilities to support AI initiatives. Here's how OLAP and data warehouses are used in AI: Data Preparation and Integration: Before AI models can be trained, they require high-quality, well-structured data. Data warehouses act as centralized repositories where data from various sources can be cleansed, transformed, and integrated. OLAP capabilities allow data to be organized into meaningful dimensions and hierarchies, making it easier for AI systems to process. Feature Engineering: Feature engineering is a crucial step in building AI models. Data warehouses and OLAP systems can assist in creating derived features by performing aggregations, calculations, and transformations on the stored data. These features serve as inputs to AI algorithms, improving their performance and accuracy. Training Data Storage: Data warehouses provide a reliable and scalable environment to store the large volumes of data required for training AI models. They ensure data is easily accessible, well-organized, and available for repetitive model training without the need to repeatedly query operational databases. Historical Analysis for AI Models: AI models often benefit from historical...
 |
Click this screenshot to view a three-minute demo and get an overview of what InetSoft’s BI dashboard reporting software, Style Intelligence, can do and how easy it is to use. |
How Data Mashups Work - OK, let’s drill into the underpinnings of this stuff because we talked earlier about APIs and third party data, and so forth, and ideally with a mashup, again, you want to enable these end users to mix and match data sets very easily. So how do you deal with that marshalling area of data? Do you, for example, are you just exposing a range of data feeds, and is that in your product, or do you leverage another product? How does that work? So specifically in our product, it’s all homegrown technology. The common context, so to speak, is as Jim would say, at the metadata, always. So it doesn’t really matter where the data is coming from...