Dashboard Application for Business Intelligence from InetSoft
InetSoft's application for business intelligence dashboards is easy, agile and robust. InetSoft is top-rated by users on G2 Crowd. Interact with examples and register for a personalized demo.
All new clients and partners get free one-on-one business intelligence expert help to accelerate deployment.


Register for more info and free software
About InetSoft
Since 1996 InetSoft has been delivering easy, agile, and robust business intelligence software that makes it possible for organizations and solution providers of all sizes to deploy or embed full-featured business intelligence solutions. Application highlights include visually-compelling and interactive dashboards that ensure greater end-user adoption plus pixel-perfect report generation, scheduling, and bursting. InetSoft's patent pending Data Block™ technology enables productive reuse of queries and a unique capability for end-user defined data mashup.
This capability combined with efficient information access enabled by InetSoft's visual analysis technologies allows maximum self-service that benefits the average business user, the IT administrator, and the developer. InetSoft was rated #1 in Butler Analytics Business Analytics Yearbook, and InetSoft's BI solutions have been deployed at over 5,000 organizations worldwide, including 25% of Fortune 500 companies, spanning all types of industries.

What Are the Filter Types for a Dashboard?
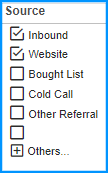
Selection Lists
The most common way to filter the values of a dimension in a Dashboard is with a Selection List. A Selection List filters the data in all tables, charts, and output components that are based on the same data block as the Selection List. A Selection List filters the data displayed by data view components (Tables, Charts, etc.) and output components (Gauges, Text). A Selection List can provide either single-selection or multiple-selection capability, and can be configured to submit selections immediately when you make the selection or on-demand when you press the 'Apply' button .
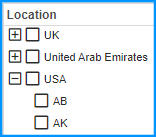
Selection Trees
A selection tree is a selection list that has built-in drill-down capabilities. It lets the users explore date in a heirarchical manner from the highest grouping levels down to the lowest grouping level.
Range Sliders
A Range Slider component allows you to select a date range or numerical range by dragging start and end points on a line using a mouse. Then you can slide the new length of the time window or numerical range to modify the view.
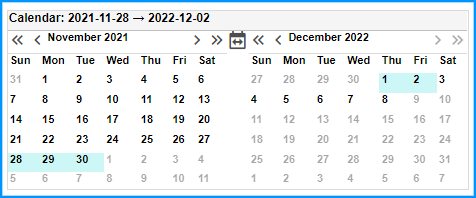
Calendars
A Calendar allows you to restrict data to a particular range of dates, either continuous or non-continuous. A Calendar is similar in purpose to a Range Slider, but provides functionality beyond simple range selection. For example, a Calendar also allows you to compare date ranges in a Chart or Crosstab.

More Resources About Dashboard Applications for Business Intelligence
Answer Any Question of Your Data - A successful business is going to be asking its data questions such as: Where are our most frequent customers coming from? Where is our weakest area? How are our sales people performing in certain divisions? Is this or that product costing us/making us money? For example, an executive might want to know: has this salesperson always been a better performer in this product division, or are they just connected to a larger customer? StyleBI can visualize all of the necessary dimensions and measures easily and in different combinations so the user can render the most accurate conclusion...
Articles About Dashboard Business Intelligence Apps - Looking for dashboard apps? InetSoft offers free and commercial Web-based dashboard software. View a demo. Try today for free. B2B Dashboard Reporting Solution - Looking for a good B2B dashboard reporting application? InetSoft is a pioneer in self-service dashboarding and offers an easy tool for B2B marketers. View a demo and try interactive examples...
Beneficial Tools for Charts and Graphs - Charts and graphs can help organize information into useful visualizations that can better help the user understand the data. Sliders help isolate a specific range in the data that the user can customize for whatever they are particularly looking for. Gauges are a popular way to display data, often paired with dynamic KPI's. Drop-down menus can be created to isolate particular variables being displayed on the dashboard...
Benefits of Big Data Visualization - InetSoft's big data visualization software provides many advantages over the competitors such as. Rapid Implementation- deployment time is minimized, requiring only a web browser for end-users and developers. Any IT person with basic database administration skills can install and set up the software...

Benefits of Online Dashboard Applications - This is a table of contents of useful product information about, and benefits of, InetSoft's dashboard application capabilities. The two related products are StyleBI, the company's business intelligence software for dashboards, reporting, and analytics, and Style Scope, the stand-alone dashboard software product: To add a Named Condition to a table in a Worksheet, follow these steps...
Business Intelligence Applications for Corporations - Looking for a good corporate business intelligence application? InetSoft is a pioneer in dashboard reporting, and our platform includes a powerful, flexible data mashup engine for generating complete views of corporate performance. View a demo and try interactive examples. A state of the art business intelligence solution will present all of your data in a way that gives end users the power of analysis, and updates in real-time to enable the accurate tracking of performance conditions...
Customize QuickBooks Online Dashboard Applications - Looking for a good dashboard application for QuickBooks Online? InetSoft's pioneering BI application produces great-looking dashboards that mashup accounting data with other data in your enterprise. View a demo and try interactive examples. The second one down from that is a dashboard. This is a very common way of organizing information for people to get the stuff they need at a glance...
Data Visualization Projects With Professional Services - So it comes together quickly, and we'll deliver these data visualization projects with professional services to get a first project running. For example, you saw several of them and then usually the client can modify it or bring up other projects. Maybe you did the call center one for the annual fund and higher education first. Okay now let's work in leadership giving, prospect identification and let's work on metrics for my co-leadership. So the second effort is really a lot easier because the core tables are linked and formatted in the way they make sense to them to modify...

Evaluate InetSoft's Smartsheet Dashboard Application - Looking for a good solution for Smartsheet dashboard reporting? Create more interactive views of your product development projects and issue tracking. Maximize self-service. InetSoft's pioneering BI application produces great-looking cloud-based dashboards with an easy-to-use drag-and-drop designer. View a demo and try interactive examples. Gain greater self-service from personalized dashboards to easier design of new analytics...
Get the Most Out of Data Visualization - For this reason, we present in this post those most relevant aspects to take into account to get the most out of data visualization in our professional projects: 1. What are we going to tell. A common mistake when viewing information is trying to cover too much. We must know what we want to count and be precise in the information that we are going to show in the visualization...
Information About Digital Dashboard Software - Looking for digital dashboard software? InetSoft offers Web-based dashboard software that enterprises can deploy quickly, and ISV's can embed easily into their own applications. View a demo. Read customer reviews. The goal is to really design things that solve real business problems. Now, in our case these problems are information problems, and beauty and aesthetics, these are just the byproduct of a great design, but they are not the goal. Dashboards are there to make our life easier. They are supposed to help you become better in what you do, and they are unique to solve problems that other forms reporting simply cannot...
Interactive Online Visualizer - InetSoft's online data visualizer stands apart from the rest with the flexibility and interactivity that is offered to users. Not only can dashboards be created using a simple drag and drop interface, but interactive features allow users to drill down and explore data more than ever before. Users can brush, highlight, and isolate data in order to highlight relevant information that can lead to a new discovery of trends that could not be seen before when looking at raw data...

Insurance Claims Dashboard Example - The Insurance Claims Dashboard example here demonstrates InetSoft's user-friendly analytical dashboards, perfect for organizations in need of a customizable and interactive software to assist in everyday operations. The particular chart below portrays some of the many tools that InetSoft carries in addition to featuring a multi-dimensional view on the data. InetSoft's solution provides users with a large collection of visualizations and charts to create dashboards that meet their criteria or are easy to analyze. Simplifying the process even further, the point and click environment allows users to easily drill down into their data sets by claim type, claim status, gender, and age for a detailed analysis...
Library of Interchangeable Data Visualizations - In the airline demo, we used a map and a graph matrix. StyleBI has a large library of interchangeable visualizations including bubble charts, area charts, heat maps, line charts, bar charts, and many others, and they are all designed to help you get the answers you need. Over time, we will continually add to this visualization library to deliver even more insights. With StyleBI, getting to the answer is simple and fast...
Look at a Huge Array of Information - If I am really going to use a scatter plot, that enables me to use and to look at a huge array of information, across product lines or across timeframes whereas if I am just using a map or if I am using a bar chart, I don't have that same interaction in contextual fields with the data that I need. So I think that that's actually a big issue, and that's for people who already have embraced visualization...
Mobile Business Intelligence Dashboards for Tablets - With one BI application, serve mobile business intelligence dashboards to iPhones, iPads, Android-based tablets, smartphones, as well as full dashboard reporting to PCs, Macs, and laptops. While StyleBI employs a design-one, deploy everywhere approach, depending on the level of interactivity and frequency of use, you might prefer to design a mobile-optimized version of a dashboard that had originally been created for the desktop...

SME Business Intelligence Software - Are you a small or mid-sized firm looking for good business intelligence software? InetSoft, a pioneer in self-service dashboarding, gets high grades for personalized support. View a demo and try interactive examples. They ranked StyleBI second in business intelligence data products most frequently selected for in-depth evaluation and comparison. When the analysis firm did a comparison of 36 different BI vendors, InetSoft was in the top ten of every category...
This Year's Best Management Dashboard Application - Looking for the best management dashboard application for tracking KPIs and managing performance? Since 1996 InetSoft has been making management and executive dashboard software that is easy to deploy and easy to use. Its unique data mashup capabilities enable unified views of corporate performance and maximum self-service. View a demo and try interactive examples. Start by viewing demos for each one. InetSoft offers Web-based dashboard software that is easy to use and quick to deploy...
Way to Track Business Intelligence Metrics - Searching for a way to track business intelligence metrics? InetSoft offers an easier to use, easier to deploy BI platform that is also more cost-effective. Read about using InetSoft's BI software. Soft and Hard KPIs - Are there "soft" and "hard" KPIs? Yes, it very much depends on what KPI are measuring. You can have certain soft metrics where you relying on people's experience. You need to have outside factors that you weigh in, and then you discuss it. And then there are certain very hard KPIs...