Why an FMCG Company Switched to InetSoft for Its Digital Dashboard Software
In the fast-moving consumer goods (FMCG) industry, speed and clarity are everything. Sales teams need to know which promotions are working this week, supply chain managers must spot stock-outs before they hit the shelf, and finance leaders want margin visibility across thousands of SKUs and channels. One global FMCG company realized that its existing digital dashboard software was no longer keeping up with this pace. Static reports, siloed data, and limited self-service meant decisions were often based on outdated or incomplete information.
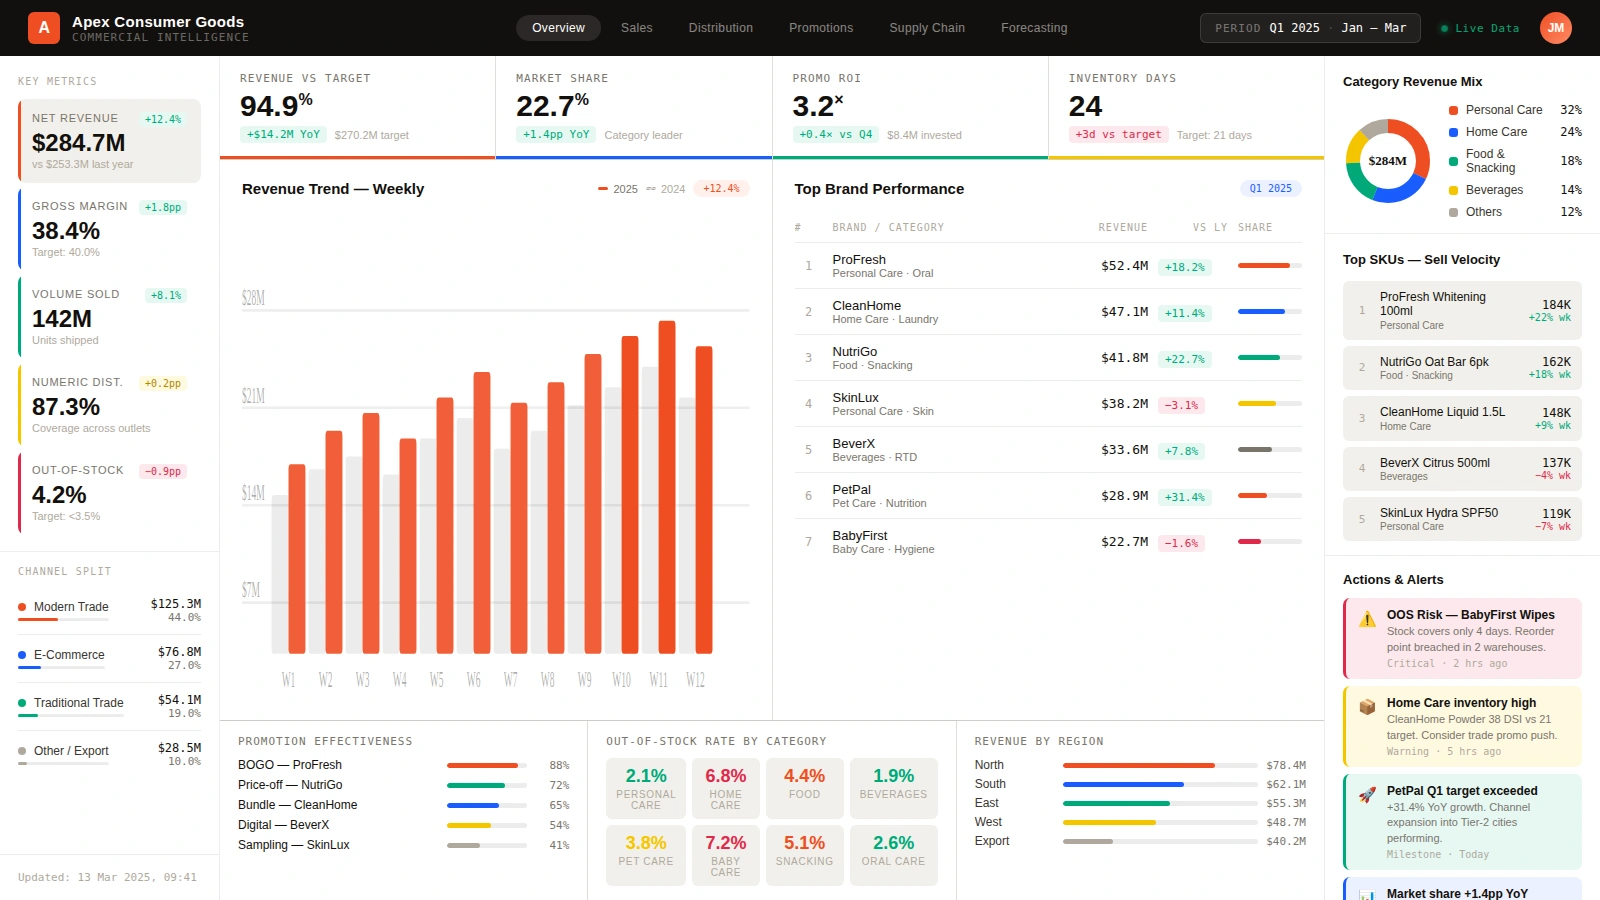
After a thorough evaluation of several business intelligence and dashboard tools, the company decided to switch to InetSoft as its core digital dashboard software. The move was not just a technology refresh; it was a strategic shift toward real-time, role-based visibility across the entire value chain—from raw materials to retail execution.
Challenges with the Previous Dashboard Environment
Before adopting InetSoft, the FMCG company relied on a mix of legacy BI tools, spreadsheet-based reporting, and manually assembled slide decks. While these solutions had evolved over time, they shared several critical limitations that became more painful as the business grew:
- Fragmented data: Sales, trade promotions, inventory, and marketing data lived in separate systems, making it difficult to get a single version of the truth.
- Slow reporting cycles: Weekly and monthly reports required manual extraction and consolidation, delaying insights and limiting agility.
- Limited self-service: Business users depended heavily on analysts and IT to build or modify dashboards, creating bottlenecks.
- Lack of role-based views: Field sales reps, key account managers, and executives often saw the same dashboards, even though their needs were very different.
- Inflexible layouts: Existing dashboards were difficult to adapt for mobile devices and retailer-specific presentations.
As the company expanded into new markets and channels, these issues translated into missed opportunities. Promotions were not optimized in time, out-of-stock events were discovered too late, and leadership lacked a clear, real-time view of performance across regions and brands.

Why InetSoft Was Selected as the Digital Dashboard Platform
The evaluation team—composed of IT, sales operations, supply chain, and finance stakeholders—identified several capabilities that were non-negotiable for the next-generation digital dashboard software. InetSoft stood out by combining strong data integration, flexible dashboard design, and true self-service analytics in a single platform.
First, InetSoft’s data integration layer allowed the company to connect to its ERP, CRM, trade promotion management system, syndicated market data, and retailer POS feeds. Instead of maintaining separate dashboards for each source, the team could build unified views that blended shipment, sell-in, and sell-out data with promotional spend and inventory levels. This was especially valuable for understanding promotion effectiveness and retailer performance.
Second, the platform’s layout designer gave the FMCG company precise control over how information was presented. They created standardized templates for:
- Executive performance dashboards with high-level KPIs by region, category, and brand.
- Key account dashboards tailored to specific retailers, showing joint business plan metrics, promotion ROI, and on-shelf availability.
- Field sales dashboards optimized for tablets, highlighting store visit priorities, compliance photos, and real-time stock alerts.
- Supply chain dashboards tracking forecast accuracy, service levels, and inventory health across plants and distribution centers.
Third, InetSoft’s self-service capabilities meant that business users could adjust filters, drill into details, and even create new views without writing code. Analysts still played a key role in defining governed data models and KPIs, but day-to-day exploration no longer required IT tickets or long development cycles.

Implementation Approach and Change Management
The transition to InetSoft was executed in phases to minimize disruption. The company started with a pilot focused on one strategic region and a subset of brands. The initial scope included:
- Sales performance dashboards by channel and key account.
- Promotion effectiveness dashboards combining spend, uplift, and margin impact.
- Supply chain dashboards for service level and stock-out monitoring.
During the pilot, the legacy dashboards and InetSoft dashboards ran in parallel. Sales leaders and planners were encouraged to compare the two and provide feedback on usability, layout, and metric definitions. This iterative approach surfaced important improvements early, such as:
- Making promotion KPIs more prominent and color-coded by performance bands.
- Adding store-level drill-downs for key accounts to support joint business reviews.
- Highlighting at-risk SKUs with simple, intuitive alert icons.
Training was tailored to each role. Executives focused on interpreting KPIs and using filters during performance reviews. Key account managers learned how to customize views for retailer meetings. Field sales teams were trained on mobile-optimized dashboards that guided their daily store visits. Analysts and IT staff received deeper training on InetSoft’s data modeling and dashboard design capabilities.

Operational and Strategic Benefits After the Switch
Once the company rolled out InetSoft across regions and business units, several tangible benefits emerged. Decision-making became faster, more collaborative, and more grounded in shared data.
In sales and trade marketing, teams could see promotion performance in near real time. Underperforming promotions were identified quickly, allowing the company to adjust tactics, reallocate spend, or negotiate with retailers before the campaign ended. High-performing promotions were documented and reused as best-practice playbooks.
Supply chain teams used InetSoft dashboards to monitor service levels and inventory health across the network. Early-warning indicators for stock-outs and excess inventory helped planners adjust production and deployment plans. This reduced both lost sales and write-offs, directly impacting profitability.
For executives, InetSoft became the single pane of glass for performance management. Instead of reviewing static slide decks, leadership meetings now centered on live dashboards where participants could filter by region, brand, or channel and drill into the underlying drivers. This shifted conversations from debating numbers to aligning on actions.

Building a Culture of Data-Driven Execution
Perhaps the most important outcome of switching to InetSoft for digital dashboard software was cultural. By giving each role a tailored, intuitive view of the business, the FMCG company made data part of everyday execution rather than a monthly reporting ritual.
Field teams felt more empowered because they could see the impact of their actions in real time. Key account managers entered retailer meetings with clear, visually compelling stories backed by consistent data. Executives gained confidence that everyone—from planners to sales reps—was working from the same metrics and definitions.
In the end, the move to InetSoft was not just about better dashboards. It was about creating a connected, responsive organization where insights flow quickly and decisions are made with clarity. For a company competing in the high-speed world of FMCG, that shift became a lasting competitive advantage.
More Articles About Digital Dashboard Software

Dashboarding Tool Properties - Full control over dashboarding tool properties is just one of the robust features found in all of InetSoft's BI Software. The ‘Properties’ dialog box for Slider and Spinner components provides the following tabs: General, Data, and Advanced. The next sections discuss the input-specific properties available under these tabs. The General tab in the Slider and Spinner ‘Properties’ dialog box provides the following unique properties. Number Range Minimum: The starting value Maximum: The ending value Increment: The points at which the values are displayed. The Data tab in the ‘Properties’ dialog box for input components provides the following input-specific properties: Table An Embedded Table in the Worksheet. The ‘Browse’ button to the right allows you to interactively select the row and column. Column The column of the Worksheet Embedded Table into which the input value should be passed. Row The row of the Worksheet Embedded Table into which the input value should be passed. (The ‘Row’ menu displays the format “row: row value...
Dashboarding Tools - InetSoft's dashboarding tools offer a high level of control over graphical display missing from most other applications. Sliders and Spinners are interactive elements which are typically used to enter numeric data into an Embedded Table in the underlying Worksheet. Sliders and Spinners differ only in appearance. To create a Spinner, follow the steps below. (The Slider is identical.) 1. Drag the ‘Spinner’ element from the component tree into the Viewsheet grid. This creates an empty Spinner in the Viewsheet grid. 2. Right-click on the Spinner, select ‘Properties’ from the context menu. This opens the ‘Spinner Properties’ dialog box. 3. Under the General tab, specify the ‘Minimum’ and ‘Maximum’ values. 4. If you will use the Spinner to control dynamic properties of another element, follow these steps: a. Enter a ‘Name’ for the control. This is the name by which the control is identified in dynamic property menus. (See Using Input Controls to Set Properties.) b. Click ‘OK’ to finish. Note: If you plan to use the Slider or Spinner to set dynamic properties, you do not need to specify an Embedded Table in the Data tab. 5. If you will use the Spinner to control values in a Worksheet Embedded Table, follow the steps below: a. Select the Data tab. b. From the ‘Table’ list, select an Embedded Table Data Block in the linked Worksheet...

Dashboards Are Critically Important for the CFO - There needs to be one version of the truth, one harmonized and integrated view of both internal data as well as access to external data. Being able to deliver mobile decision support in a role-specific way is another. Dashboards are critically important for the CFO and all CXOs, in fact, but the dashboard the CFO needs is quite different from what the head of operations and the head of sales needs. It is quite different from what the CEO needs and on and on it goes all the way down to the front-line manager. So being able to present that one view with the truth in a role-specific way, specially optimized for mobile devices because we are talking about moving that decision from the boardroom all the way to the edge of the organization, having that role specific in presentation layer if you will is essential and critical. Being able to process or rewrite existing BI apps for mobile, again you can see that the leaders really trump followers in this regard. And there are reasons for that, because there is institutional knowledge that is embodied in the creation of report. So the ability to access those now are from all points, both mobile, desktop and anywhere else is becoming essential, and the leaders know that making the data as agile as the device, if you will, is the part of what makes a leader...
Dashboards as a Type of BI Application - So, let's move onto dashboards as a type of BI application, and what I want to do is, I want to start with misconceptions. I want to tackle that one first, because that really troubles me when I hear it. Here's the misconception. Dashboards are just making data flashy. Some people seem to have to believe that data is boring, and that in order to make people pay attention, we need to load them into flashy graphics, things that move around, and with big dials. There is definitely importance to the look of a dashboard, but what I want to stress in the beginning is that dashboards are not just making data flashy. The goal is not to design things that are interesting and attractive. The goal is to really design things that solve real business problems. Now, in our case these problems are information problems, and beauty and aesthetics, these are just the byproduct of a great design, but they are not the goal. Dashboards are there to make our life easier. They are supposed to help you become better in what you do, and they are unique to solve problems that other forms reporting simply cannot...

Dashboards Can Serve a New User Population - Another interesting thing about these use cases is that the dashboards can serve a user population who had never had access to a BI system before. Previously, these people have only been supported with static reports which are largely insufficient to their needs. Operational reports containing huge amounts of data have been the primary means of distributing operational data, but they provide little insights because they are so big. It’s almost impossible to find or compare interesting data items because very interesting comparisons are separated by many pages. In contrast, traditional dashboards are much easier to use and consume, but because they have no detailed data. They are practically useless to operational workers who need more than trend information. Interactive dashboard combine the best characteristics of operational reports with the best characteristics of dashboards. They embed all the data of traditional operational reports into small micro databases that are embedded inside the dashboard app. We call them data grid caches. These data grid caches can easily contain many megabytes of data representing tens or hundreds of thousands of rows of data mashed up from many different data sources. Dashboard apps also contain hundreds of different views of that data arrayed in dashboard like layers and panels riding on top of the data grid cache...
Dashboards for a Company - InetSoft's visually advanced dashboard software offers a high level of customization so that users can craft the dashboards that best suit their needs. Dashboards are used for monitoring key performance indicators, as well as for exploratory data analysis. Dashboards provide users with a variety of different views of their data using elements such as charts, tables, and gauges. They may additionally provide “input” control elements to allow users to interact directly with the data and tailor data views to their own needs...
Dashboards for Business Intelligence - InetSoft's software for business intelligence dashboards uses a visualization-driven approach to enable rapid deployment of self-service business dashboards. They are business user-driven and offer strong analytic functions. Dashboards empower business users with an intuitive monitoring and analytic environment resulting in enhanced business performance, using the information stored within their performance management system. Within an executive dashboard, statistics and data for the company as a whole can be closely monitored by the people who need to know...
Dashboards and Analytics for Google Search Console - InetSoft's business intelligence dashboarding software connects to Google Search Console for better KPI dashboarding and a greater ability to drill and filter. Advanced data visualization methods such as heatmaps and bubble charts allow for visual analysis of more than two dimensions at once such as appearance volume, ranking, and CTR. Finding significant keyword performance changes over time is also easier. Google has made available a vast amount of detail by query, no longer just rolled up into aggregates. With access to what is essentially a Big Data source, you need a more flexible but easy-to-use data analytics tool such as InetSoft's. While Google's built in charts and filters are quite helpful, they are limited to two-dimensional line charts and data tables which you need to export to do further analysis on. With a live connection to GSC data, InetSoft's tool allows more efficient repeatable analysis and weekly dashboarding...
Dashboards for Microsoft Access by InetSoft - Looking for business intelligence dashboards for use with Microsoft Access and other similar data sources? InetSoft offers award winning dashboard solutions. Why use Business Intelligence tools? The Information Age presents businesses with big problems and even bigger opportunities. The wealth of information available to businesses poses the problem of how to effectively manage, view, and interpret data. Data sources, like Microsoft Access, allow users to store multiple complex databases. Effective dashboard tools will allow users to compare their many data sets, display data mashups in a user friendly format, and enable users to interpret the results in a meaningful way. Companies that are equipped with business intelligence dashboards are better able to: detect problem areas, spot opportunities, improve data accuracy, and...

Dashboards for Software Consulting Services - Software consultant services involve providing expert knowledge in the software space for businesses. The consultants offering these services help businesses to design and develop the most effective software products for their unique processes. To do this, consultants use a variety of data to determine the focus areas of a software project. 90% of businesses believe data is key to their digital transformation initiatives. This is because data helps consultants to identify trends, make informed decisions and predict outcomes. Data can also show possible risks and challenges that may need to be avoided or overcome. However, data typically comes in large batches that are difficult to manage. As a result, many consultants turn to dashboards to house data, manage it effectively and use it optimally. Dashboards offer consultants one screen that showcases all data, allowing them to make predictions and create reports for clients and stakeholders with measurable data visualizations. Dashboards provide aggregate data that can contribute to the overall success of a business' software efforts...
Data Analysis Dashboard - InetSoft's data analysis dashboard is an innovative web-based software application that produces brilliant visualizations of multidimensional data. Selection components provide both input and output capability, and are therefore crucial for analysis. • Selection components control and filter data for data view and output components. By adding multiple selection elements, you exponentially increase possible views. • Selections interact with one another to provide you with instant feedback on which choices are consistent and which are incompatible. This dual nature of selections makes them an indispensable analytic component for most Viewsheets. A Selection List displays every unique value from a data field. By selecting one or more of these values, the end-user can filter the data displayed by the Viewsheet, both within output elements and other selection elements. To create a Selection List, follow these steps: 1. Expand a Data Block (table) or cube dimension in the Component tree. 2. Select one column from the Data Block, or one level from the cube dimension, and drag it onto the Viewsheet grid. To create a Selection List follow these steps: 1. Drag a Selection List element from the Component tree onto the Viewsheet grid. This creates an empty Selection List element...
Data Dashboard Examples - Data dashboards, although fairly new in the workplace, have been around for many years. These dashboards can act as a visual aid when trying to interpret key business data. There are many different types of data dashboards that can be found, and finding the correct one for your business in very important. Data dashboards are usually broken down into easy to understand sections and should be done so to allow for easy and understandable use. The first thing any manager should do is define the specific metrics that will be used in the dashboard. Once the metrics are defined, his attention the attention should be shifted to formatting. Creating an appealing data dashboard can make all the difference when presenting information to employees or clients...
Data Science Dashboard Tool - Are you looking for a good dashboard tool to display your data science model results? InetSoft's pioneering dashboard application makes producing great-looking web-based dashboards easy with a drag-and-drop designer and the ability to connect to all types of big data sources. You can also connect it to R ML models and visualize the results of changing feature inputs dynamically. View a demo and try interactive examples...
Data Visualization Dashboard Tools For A BI Portlet - Looking for visualization dashboards, standalone or as a portlet in a BI portal? Since 1996 InetSoft has been making business dashboard software that is easy to deploy and use. InetSoft's server-based dashboard application functions as a visualization tool right out of the box or can be used to create interactive data visualization portlets to run in a BI portal or other Web-based solution...
Data Visualization Dashboard Software - Looking for good data visualization dashboard software? InetSoft's pioneering dashboard reporting application produces great-looking web-based dashboards with an easy-to-use drag-and-drop designer. View a demo and try interactive examples...
Data Visualization Tool - Having the right visualization tool is critical when it comes evaluating your business process. Luckily, InetSoft's visualization tool allows users to customize their dashboards according to industry and unique business needs. InetSoft’s visualization application, the Viewsheet, is a business intelligence tool that brings the power of visualization to business executives and mainstream users. Because Viewsheets allow you to interact with data using familiar objects such as charts, sliders, and check-boxes, they are quick to learn and easy to use. They allow you to seamlessly integrate data warehouses and other BI data stores with operational data sources for a complete view of your organization. Visualization using Viewsheets goes far beyond the ad hoc querying you might use to find answers to existing questions. With Viewsheets, you will be able to explore your data from every angle, discover new patterns, test new ideas, and envision new opportunities...
Databricks Dashboard Software Alternative - Are you looking for a good alternative to Databricks dashboard software? InetSoft's pioneering dashboard reporting application produces great-looking web-based dashboards with an easy-to-use drag-and-drop designer. Mashup your databricks data with any other in your organization. Get cloud-flexibility for your deployment. Minimize costs with a small-footprint solution. Maximize self-service for all types of users. No dedicated BI developer required. View a demo and try interactive examples...

Datapine's Dashboard Application Alternative - Are you looking for a good alternative to Datapine's dashboard application? InetSoft's pioneering dashboard reporting application produces great-looking web-based dashboards with an easy-to-use drag-and-drop designer. Get cloud-flexibility for your deployment. Minimize costs with a small-footprint solution. Maximize self-service for all types of users. No dedicated BI developer required. View a demo and try interactive examples...
data.world Dashboard Solution - Looking for a good dashboard solution that is compatible with data.world? InetSoft's pioneering BI application produces great-looking cloud-based dashboards with an easy-to-use drag-and-drop designer. View a demo and try interactive examples...