InetSoft Technology: Dashboarding Objects
This section lists objects for use in executive dashboards and visualizations.
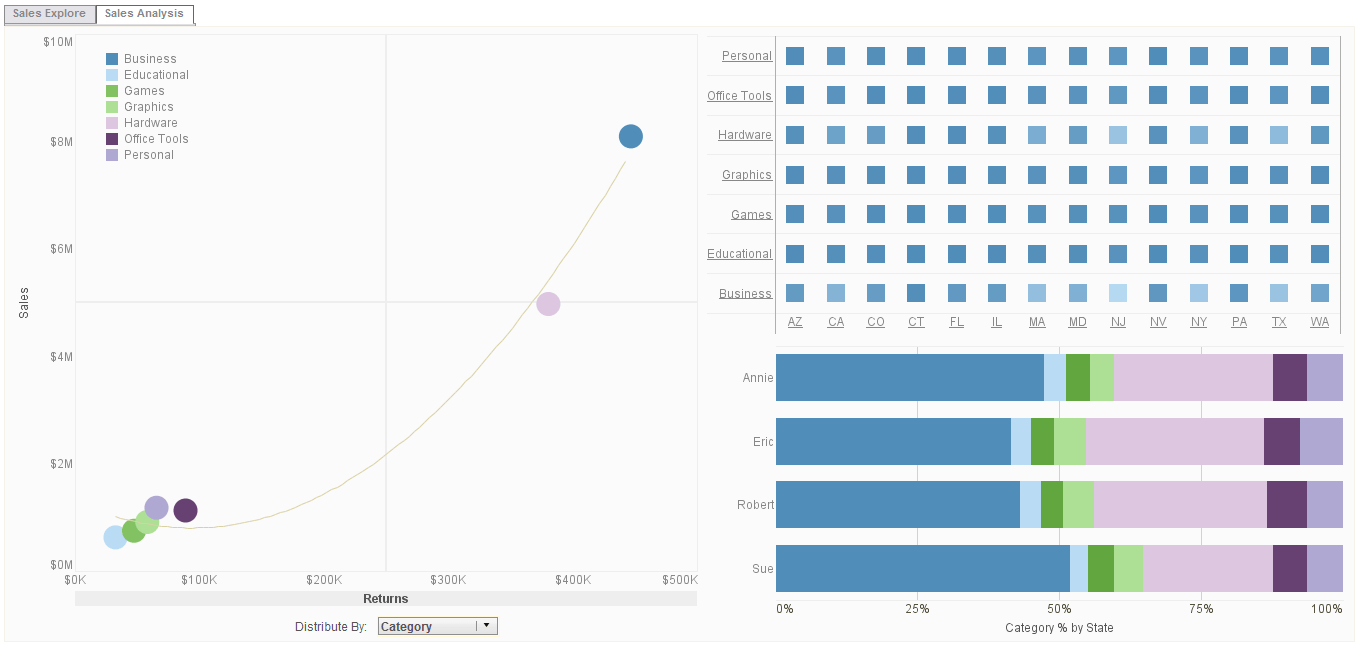 |
Click this screenshot to view a three-minute demo and get an overview of what InetSoft’s BI dashboard reporting software, Style Intelligence, can do and how easy it is to use. |
Title Properties
This section presents properties available for Graph titles. Title properties should be prefixed by either xTitle or yTitle.
xTitle.rotation
Sets the X-axis title rotation angle.
xTitle.visible
Sets the visibility of the X-axis title.
Plot Properties
This section presents properties available for the Graph plot area.
applyEffect
Enables a 3d visual effect for chart elements.
pieExploded
Separates the slices of a pie chart by a small gap.
shapeLegend.title
Sets the legend title for a shape-key legend.
 |
View a 2-minute demonstration of InetSoft's easy, agile, and robust BI software. |
The Chart bindingInfo Property
This section presents functions related to the bindingInfo property of the Graph. The bindingInfo property provides access to the binding, grouping, and aggregation settings of the Chart's 'Data Binding' dialog box.
The bindingInfo properties also control the ColorFrame, ShapeFrame, SizeFrame, and TextureFrame objects that determine visual styling for data represented on the chart (e.g., subseries).
bindingInfo.isTopNReverse(col)
Returns the state of the Top-N/Bottom-N filter.
bindingInfo.setTopNSummaryCol(col,agg)
Specifies the aggregate to be used for Top-N/Bottom-N filtering on a given field.
bindingInfo.getFormula(col,binding)
Returns the aggregation method used for a measure. The measure can be bound to the X or Y axis, or to one of the VisualFrames (ColorFrame, ShapeFrame, SizeFrame, and TextureFrame).
Data
The Chart Data object is a two-dimensional array containing the detail records (raw data) bound to a chart. You can use standard array notation, data[i][j], to access the data value in row i and column j. Use data.length and data.size, respectively, to obtain the number of rows and columns in the raw data.
For example, consider the following chart bound to the 'All Sales' query.
To obtain the raw (pre-aggregate) data behind the chart, use the data array.
Example
var str = "";
for (var i = 0; i < data.length; i++) {
   str = "";
   for (var j = 0; j < data.size; j++) {
      str += data[i][j] + ", ";
   }
   log(str);
}
You can assign the results of a runQuery() function to the Data object to set the chart dataset:
data = runQuery("sales by state");
 |
Read what InetSoft customers and partners have said about their selection of Style Report as their production reporting tool. |
Table
The Chart's Table object is a read-only two-dimensional array containing the aggregates records (summarized data) bound to a chart. You can use standard array notation, table[i][j], to access the data value in row i and column j. Use table.length and table.size, respectively, to obtain the number of rows and columns in the summarized data.
The values provided by the Table object are the same as those provided by the DataSet object, except that the first row, table[0][j], contains the column headers rather than the first row of data.
For example, consider the following chart bound to the 'All Sales' query.
Example
// First row of 'table' has headers: Employee, Sum(Total)
var str = "";
for (var j = 0; j < table.size; j++) {
  str += table[0][j] + ", ";
}
log(str);
 |
Read what InetSoft customers and partners have said about their selection of Style Scope for their solution for dashboard reporting. |
Field Object
Field object is the base class for all other form elements, including button, image button, choice, text field, and text area.