Balanced Scorecard for Performance Management - The balanced scorecard is a strategic planning and management system that is used in business and industry, government, and nonprofit organizations worldwide to align business activities to the vision and strategy of the organization, improve internal and external communications, and monitor organization performance against strategic goals...
Balanced Scorecard for Reports - InetSoft's reporting software comes equipped with balanced scorecards for reports that can be set up to provide critical up to the minute updates as often as needed. View the information below to learn more about the Style Intelligence solution. A scorecard is used to keep track of certain parameters (e.g., Sales Revenue). Multiple users can monitor these parameters from the Report Portal. These parameters (metrics) can also be measured at regular intervals (triggers). They can be checked against certain conditions (thresholds, time comparisons, custom business logic etc.) to which they must comply. If they don't, specified actions can be automatically taken (email notifications, etc.). The metric, trigger, conditions and other settings are collectively handled as a target. A scorecard is thus a collection of one or more targets. Consider the following use of a scorecard: A company aims for a 2% increase in sales revenue every month. A sales manager wishes to closely monitor this metric to ensure a sustained increase in the revenue. We create a data asset (in the Asset Composer) which calculates the total sales revenue of the company for each month. We create a metric based on the 'Revenue' field of this asset. We optionally associate a detail report with this metric, based on the asset (e.g., a chart plotting the sales revenue on the Y-axis and month on the X-Axis...
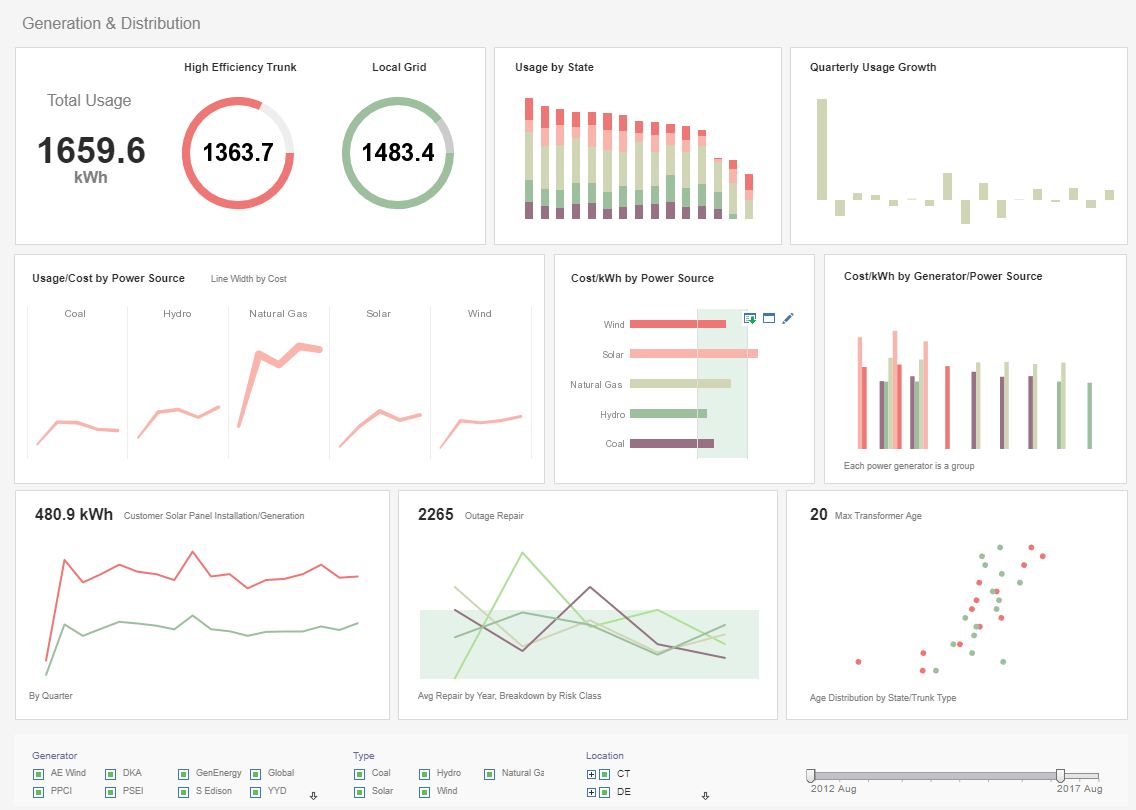 |
Click this screenshot to view a two-minute demo and get an overview of what InetSoft’s BI dashboard reporting software, Style Intelligence, can do and how easy it is to use. |
Behavior-based Analytics Dashboard for Kissmetrics - Looking for a good solution for Kissmetrics dashboard reporting? InetSoft's pioneering BI application produces great-looking cloud-based dashboards with an easy-to-use drag-and-drop designer. Mash up your marketing campaign data with other enterprise sources for a unified view of marketing performance. View a demo and try interactive examples...
Benefits of Box Dashboards and Reports with InetSoft - Project and workflow reporting represents the critical reporting relationship between project managers and employees, as well as managers and executives. Using an agile status reporting tool such as InetSoft's Style Intelligence provides users an efficient platform to create reports and keep management updated on company and employee progress...
Benefits of Dashboards for the Consulting Industry - The consulting industry is a data-driven activity that relies on in-depth analysis of every facet of the business in question. Whether you are a strategy, management, or operations consultant, you need tools to facilitate efficient data processing. Modern-day human resources and financial advisory consulting companies also rely on real-time data acquisition...
 |
Read what InetSoft customers and partners have said about their selection of Style Scope for their solution for dashboard reporting. |
Benefits of Dashboards for Customer Service Centers - As the businesses compete harder, companies are coming up with multiple effective ways to reach customers. In the present day, hardly any businessperson dreams of being in a local business forever. Rather, their primary aim is to reach up to the global customers with their services and commodities. In such a scenario, most companies need to maintain excellent communication with the customers and hire efficient customer care executives. These customer executives make sure that every customer can present their queries and problems before the company. Most of the work takes place over the telephone, and in the majority of the cases, things get resolved easily. However, the above phenomenon is possible due to the presence of dashboards that provide visualized data to the customer service managers of a specific business organization. At present all large and medium businesses and organizations use dashboards at their customer service centers. Furthermore, the BPOs use it too. Here, you can go through the benefits that a dashboard can provide your company in the field of customer service...
Benefits of Dashboards for the Mining Industry - If you don't already work actively in the mining industry or on a mine, you might not understand the benefits of a mining industry's dashboard. There are a lot of challenges that the operators and mining process engineers face that need adequate solutions. However, to proffer the adequate solution, there has to be a quantitative and in-depth knowledge of the relevant parameters and processes surrounding those challenges. This is where the importance of the dashboard within the mining industry starts to show itself. With the dashboard, operators can quickly get all the information that they need to understand the problem at hand and provide a long-lasting solution to it. The fact that dashboards are data-driven and produce real-time and reliable estimates of the variables surrounding a process correlated with other systems and are used as vital tools in solving problems make them something of a necessity for the mining industry. Just in case you still are not convinced about the benefits of the dashboard for the mining industry, this article from authors at essay writing service reviews highlights some of the significant benefits of the dashboard for this industry...
Benefits of Dashboards for Software Consulting Services - Software consultant services involve providing expert knowledge in the software space for businesses. The consultants offering these services help businesses to design and develop the most effective software products for their unique processes. To do this, consultants use a variety of data to determine the focus areas of a software project. 90% of businesses believe data is key to their digital transformation initiatives. This is because data helps consultants to identify trends, make informed decisions and predict outcomes. Data can also show possible risks and challenges that may need to be avoided or overcome. However, data typically comes in large batches that are difficult to manage. As a result, many consultants turn to dashboards to house data, manage it effectively and use it optimally. Dashboards offer consultants one screen that showcases all data, allowing them to make predictions and create reports for clients and stakeholders with measurable data visualizations. Dashboards provide aggregate data that can contribute to the overall success of a business' software efforts...
Benefits of Using Executive HR Dashboards - Having a human resources dashboard seems to be a new trend in the HR industry. And it's no wonder â€" these dashboards have many advantages to them that can improve your business. Here are the benefits of using HR executive dashboards. #1 Better Employee Retention Employee retention is one of the most important pain points for many business owners. It depends on a variety of factors which is why it is so hard sometimes to ensure that your employees aren't constantly looking for a better job than what they have at your company. HR executive dashboards allow you to view various metrics and reports. This, in turn, helps you predict which aspects of your business need to be improved to keep the satisfaction levels of your employees high. #2 Viewing Everything in One Place Speaking of having an overview of your metrics and reports, HR executive dashboards allow you to view everything in one place. They literally collect all the important information in one location giving you a complete picture of your business. For example, you can see such data as employee attendance or compensation or anything else you can think of. Then, you can compare different metrics between employees and compare them to your expectations...
 |
“Flexible product with great training and support. The product has been very useful for quickly creating dashboards and data views. Support and training has always been available to us and quick to respond.
- George R, Information Technology Specialist at Sonepar USA
|
Best Campaign Dashboard Report - Searching for the best dashboard reporting solution for your business campaign? InetSoft’s unique dashboard software, Style Intelligence, allows users to easily create Web-based dashboards that are operational and effective in creating analytical reports. The interactive features of InetSoft's design allow you to shift from a high-level view of marketing performance to an in-depth view of detailed metrics and statistical analytics. Style Intelligence's interface makes the dashboarding tool easy to deploy and easy to utilize, reaching the maximum level of self-service and efficient business...
Best Commercial Dashboard - Dashboards create visual representations of metrics and performance scorecards at a specific point in time. In order for a manager to fully understand the status of key performance indicators, it is a necessity to have an advanced and interactive dashboarding tool..
Best Customer Relationship Management Dashboard - CRM software allows a business to manage company interactions with past, present, and future customers. In order to increase revenue, a company must foster effective marketing strategies and end initiatives that are performing poorly. Using CRM software, such as that which is provided by salesforce.com, in conjunction with a BI suite like Style Intelligence, allows users to monitor and visually represent statistical data. Using custom generated reports, managers can counter shifts in customer needs before problems even have an opportunity to arise. InetSoft's unique dashboarding tool is fully compatible with all salesforce.com software, providing visual dashboards for tracking key performance indicators and other in-depth metrics.