InetSoft's Data Mashup Engine as a Data Warehousing Software Alternative
Are you considering whether to purchase data warehousing software or not? InetSoft's business intelligence software can access data warehouses and can also mashup operational data stores directly, saving the cost of acquiring data warehouse software. Read articles below about InetSoft's software for dashboards, reporting, and data integration:
JavaScript Object-Oriented Concepts - JavaScript is an object-oriented programming (OOP) language, and provides various objects and methods, as well as the ability to create user-defined methods. To use JavaScript effectively, it is important to understand the following concepts. Properties are predefined data-storage locations associated with an object. You can 'get' or 'set' these properties to observe or alter the corresponding attributes of the object. For example, every report element has a visibility property: Table1.visible = false; Methods are predefined functions associated with an object. (In general, these functions operate on the object itself.) For example, the CALC object provides a method for obtaining today's date: Text1.text = CALC.today()...
|
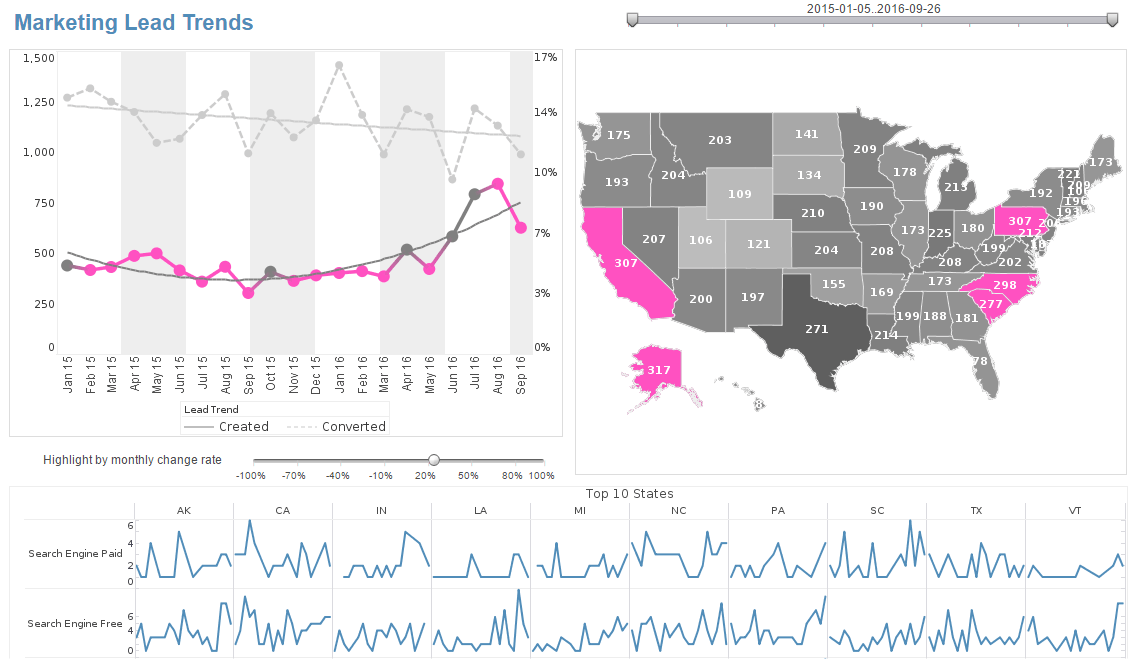
Click this screenshot to view a two-minute demo and get an overview of what InetSoft’s BI dashboard reporting software, Style Intelligence, can do and how easy it is to use.
|
Joining Multiple Data Sources - To embed static data manually into an element (Table, Section or Chart), follow these steps. 1. Right-click the element and select ‘Bind Data’. This opens the ‘Data Binding’ dialog box. 2. Under the Data tab in the ‘Data Binding’ dialog box, expand the ‘Report’ node, and select ‘Embedded Data’. 3. Click the ‘Edit’ button on the right. This opens the ‘Embedded Data Editing’ dialog box. 4. In the ‘Embedded Data Editing’ dialog box, enter values in the ‘Rows’ and ‘Columns’ fields to specify the table size. You can also specify Header and Trailer rows and columns. 5. Click on the table cells to enter values. Specify the data type for each cell from the pop-up menu within the cell...
List Comparison for Queries Using Hierarchical Meta Data - If you want to get a list of all employees with C++ programming skill, you can add a condition to the employee node to select only people with C++ on their skill list. However, since each employee may have multiple skills linked in the employee record, a simple string comparison does not give the correct result. This condition would work if all employees only had one skill listed. If the C++ programming were listed as the second skill of an employee, the comparison would return false because a list of skills is converted to a scalar value by using the value of the first child. You need an expression to compare the skill list with a value, and the comparison should be true if any value on the list matches the skill. The following list comparison expression returns the correct result...
| #1 Ranking: Read how InetSoft was rated #1 for user adoption in G2's user survey-based index |
|
Read More |
Machine Learning Analytics Company - As a machine learning analytics company, we tend to focus on automation, time savings, and something that we are going to talk about in more detail later, graphical interfaces that can bring people who know more about the business closer to the data. Proprietary solutions also tend to focus on the deployment of models. We were talking about one sort of workflow which when the data scientist develops the model and then hands it off to a programmer to deploy the model. Well, we see InetSoft and other proprietary solutions working towards a one click sort of deploy button, and what a time savings that can be for an organization. What we want to look for and things that we've done is how do we feed the creativity of data scientists, and we think that allowing for bi-directional integration with open source products is one way. I can be in InetSoft, and make calls out to Open Source. Then we're talking about things like using the open standard of a PMML. I think it's really silly, and I do see less and less of this, thank God, people debating is R better than Python better than InetSoft? These are not productive discussions, I don't think. I mean I think it's good to know which tool to use for what. I certainly think that's good. I teach a data mining class and where I expose this to my students. Know which tool saves you the most time at what point of the process. I think that's more important...
Machine Learning Examples in Higher Education - We are currently witnessing how technology changes the world and education in particular. Big Data and Machine Learning have always on everyone's radar due to its unexpected still paramount influence on our daily lives. We certainly remember all the retail, social media, those Tinder ground-breaking cases and other ways to use Big Data, but how has it changed things as fundamental as, say, education? According to Knewton, there are five types of data in the education sector: personal data e-learning (digital workbooks, online courses) student engagement data learning material effectiveness data administrative data forecasting data Let's find out how each sort of data contributes to shaping and improving contemporary education. Personalized Education Globally, the objective of Machine Learning is to enhance the processes and education industry is not an exception for that matter. Educational Data Mining is seen as the most powerful instrument to increase the effectiveness of education as it is today. The following is being achieved through designing those data analysis methods which will enable us to rethink the approach, fill in the gaps and adapt the accumulated experience in order to transform the system...
|
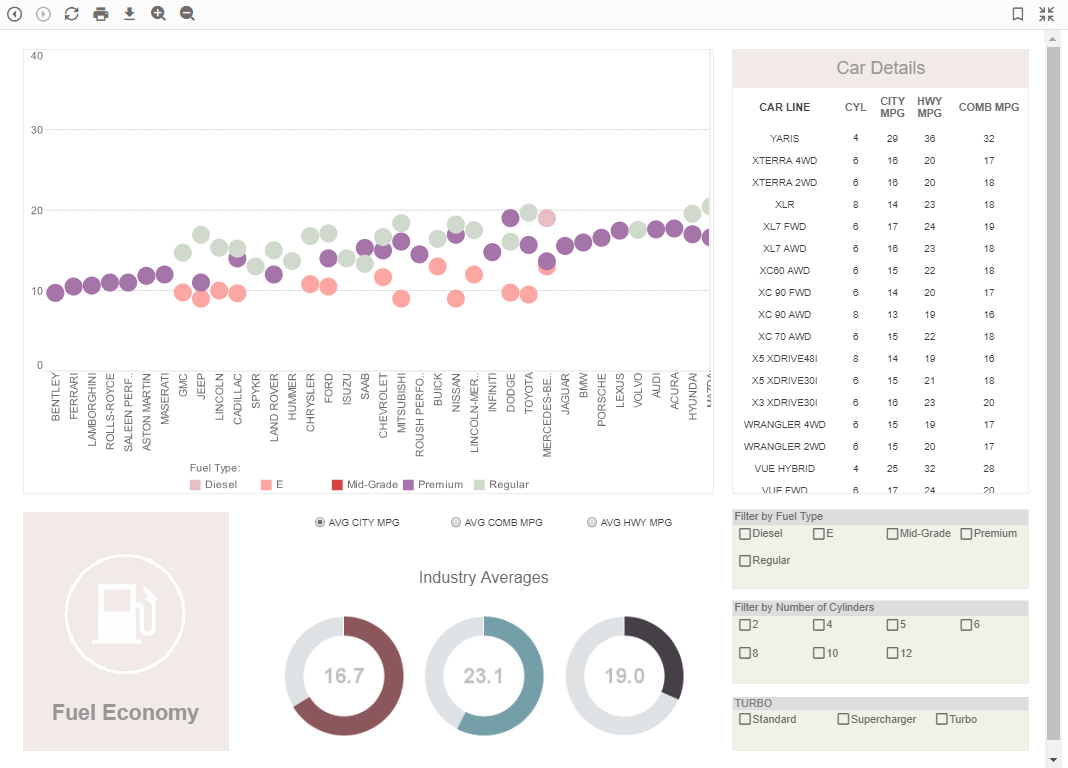
Click this screenshot to view a two-minute demo and get an overview of what InetSoft’s BI dashboard reporting software, Style Intelligence, can do and how easy it is to use.
|
Machine Learning Solves Business Problems - Where is machine learning being leveraged to help solve real business problems nowadays? We see a few main areas where enterprises are looking for business value and business benefits and applying machine learning to their daily operations. The first category is a top line growth. This is about serving better recommendations to customers, finding the right customers, finding the right opportunities, approaching them in the right way and upselling and cross-selling in order to drive the top line. Recommended systems is primarily a domain of natural language processing, of sales cycle, sales insight systems, as well as marketing optimizations. The second big area is to help re-imagine business processes with digital intelligence. So this is not just about redoing what we do today with ML insight but about truly rethinking the end-to-end process in a way that this leverages ML capability to deal with the routine and the optimal current cases, and this can have tremendous bottom line benefits. The third category is about employee engagement and having healthier and more satisfied employees with a more varied set of challenges during their working hours because again they can focus on the top and to the underserved cases that require new thinking and that require unstructured problem solving. This also includes automating away some of the mindless or repetitive tasks that nobody particularly enjoys about their daily activities today...
Make Data a Critical Organizational Asset - Few could dispute that data is a crucial asset in the modern business enterprise. This has certainly always been the case for the data that represents an organization's internal health and growth, such as expenditures, revenues, payroll, etc. But data that businesses collect about customers and the broader public and market now represents an even more critical asset. In certain cases this collected data may even constitute the "crown jewels" of the organization, and be considered more valuable and marketable than any other asset possessed by the enterprise. What has made customer data so crucial to modern businesses is a combination of two technologies. The first technology is content customization, the ability to adapt content and advertising to the individual customer. This is easiest to appreciate in the context of digital delivery of videos and other media, where content and ads are tailored to the individual viewer. But the development of content customization has penetrated less conspicuous areas also, such as the coupons delivered to customers at supermarket check-out, political fundraising emails, music playlists, financial service offers, cell phone plans, and so on...
Making Data Usable For Broad Analytics - Yeah, there is a question that one of the attendees asked, is Alteryx a data shaper, and the answer is absolutely. In addition to you mentioned Trifacta and Paxata. Those are two technologies that that were kind of born with Hadoop, and that's where you were seeing the largest variety of data. In that variety, you have to find a way of making the data really usable for broad analytics use cases. It depends on the shape of the data, whether it's a nested files or something else. And so you saw technology as Trifacta and Paxata that are really born around leveraging the Hadoop platform to do that data shaping and processing right on there. Now it has expanded to other technologies so it's not just dependent on Hadoop, but Alteryx has just gone the other way where they started with being able to shape data and prepare data off of a number of different sources whether they are now actually leveraging the processing of Spark or Hadoop to be able to do some of the transformations in memory...
Making Information the Most Valuable Commodity - There is some thinking out that at this point the most valuable commodity and manufacturing is not energy. It’s not the goods. It’s the information that you use, that information about customers, about your products, about what customers are actually looking at. How do you build an entire solution for them? Information is the most valuable commodity. Information about your supply chain, your processes, everything is valuable. The issue that you see with this right now, a lot of times is that, that information is not treated in any way, shape or form as if it is the most valuable commodity. A lot of data in a lot of firms is still scattered in lots and lots of places. It resides in a variety of different databases. It’s not uncommon to see even a small or midsized company with 20, 30, 40 different databases or more. You see a lot of data that is sitting in spreadsheets, especially for firms or plants that are using improvement methodology where they are going outside an established enterprise resource planning system. You actually see a lot of company’s data that still resides in hard copies, pieces of paper. Even when it is digitally located in databases, the issue is it’s not in a centralized database. It’s in spreadsheets. It’s in product drawings. It’s sitting on in some computers somewhere, somebody’s laptop, and that’s a problem...
Manipulate and Mashup Data - In order for a BI software to deliver maximum performance and answer business questions, it needs to have flexibility in the data sources that it can access. InetSoft's Style Intelligence software lets users mashup disparate sources of data and create virtual private models, making it invaluable for BI uses such as corporate benchmarking, cost control, and risk management....
Manipulate Apache Spark Data - Nowadays all companies struggle with ever growing stores of data. Due to the increase in data storage technology, data sources have become larger and old fashioned data tools won't cut it. Big Data is hard to manage, move, report, and analyze. This is where InetSoft comes in. With some traditional tools the user may be able to look at the data, but not in real-time. Basic data tools won't deliver with the same speed and efficiency that InetSoft's Apache Spark dashboard software will. Information can also be extracted that normal data tools are unable to replicate. This creates knowledge that otherwise wouldn't exist without InetSoft...
Manipulating Data Blocks - Worksheets provide a full complement of sophisticated data manipulation tools, including joins, filters, and concatenations. You will now use some grouping and aggregation tools to manipulate the Data Block that you created earlier in Constructing Data Blocks. 1. Right-click on the table’s top row and select ‘Group and Aggregate’ from the drop-down menu. This will open the ‘Aggregate’ dialog box. 2. In the ‘Aggregate’ dialog box, make the following selections: a. For the ‘Order.Date’ field, select the ‘Group’ checkbox and select ‘Month’ from the drop-down list. b. For the ‘Product.Total’ field, select the ‘Aggregate’ checkbox and choose ‘Sum’ from the drop-down list. 3. Click ‘OK’ to exit the ‘Aggregate’ dialog box...