Upgrading Interactive Dashboard Software: A Ski Resort’s Transition from Pendio.io to InetSoft
The ski resort initially utilized Pendio.io, a cloud-based business intelligence platform appreciated for its straightforward dashboards and ease of deployment. For several years, Pendio.io provided foundational visual analytics and reporting capabilities that supported the resort's operational needs. However, as the resort grew and its data requirements became more complex, the limitations of Pendio.io became increasingly evident. The management and analytics teams required a solution capable of handling real-time data, delivering deeper analysis, and offering customizable dashboards tailored to various departments such as operations, marketing, and guest services.
Reasons for the Upgrade
While Pendio.io offered an intuitive interface, it lacked the advanced interactive features and extensive integration options the resort needed to manage its expanding operations. Managing a ski resort involves constant monitoring of weather conditions, visitor flow, ticket sales, and equipment usage, all generating large volumes of data. Different stakeholders, ranging from mountain operations staff to executive leadership, needed relevant insights presented in accessible formats to support timely decision-making.
The resort identified the need for a more comprehensive and dynamic analytics tool capable of not only producing historical reports but also generating predictive insights and proactive alerts. This requirement led to the evaluation of InetSoft, an enterprise-grade business intelligence software known for its interactive dashboards and data integration capabilities.

Advantages of InetSoft Compared to Pendio.io
- Enhanced Interactivity:
InetSoft provides a wider array of interactive components such as drill-downs, linked visualizations, and dynamic filtering, enabling users to explore data more thoroughly without specialized technical knowledge.
- Support for Real-Time Data:
InetSoft can process real-time data feeds, an essential feature for a ski resort where conditions and operational factors change rapidly, requiring immediate adjustments.
- Customizable Dashboards:
The platform allows for the creation of dashboards customized to the specific needs of different user groups, ensuring that staff members and executives receive information most relevant to their roles.
- Integration Capabilities:
InetSoft connects efficiently with various data sources, including weather monitoring systems, ticketing software, ski lift sensors, and customer relationship management (CRM) platforms, creating a unified data environment.
- Scalability and Performance:
Designed to handle large datasets and complex analytical queries, InetSoft supports the resort’s increasing data volume and analytical sophistication.

Implementation Process
The transition from Pendio.io to InetSoft was approached in phases to ensure minimal disruption. The resort’s IT and analytics teams began by assessing existing dashboards and workflows to identify essential features and areas for improvement.
Collaboration with InetSoft’s technical consultants led to the development of new dashboards leveraging the platform’s advanced features. This included integrating real-time data streams, designing intuitive user interfaces, and establishing role-based access controls.
Training sessions were conducted for users from various departments, focusing on navigating the new dashboards, customizing views, and interpreting the visual analytics provided. Continuous support was arranged with InetSoft to address technical issues and optimize dashboard performance over time.
Operational Impact
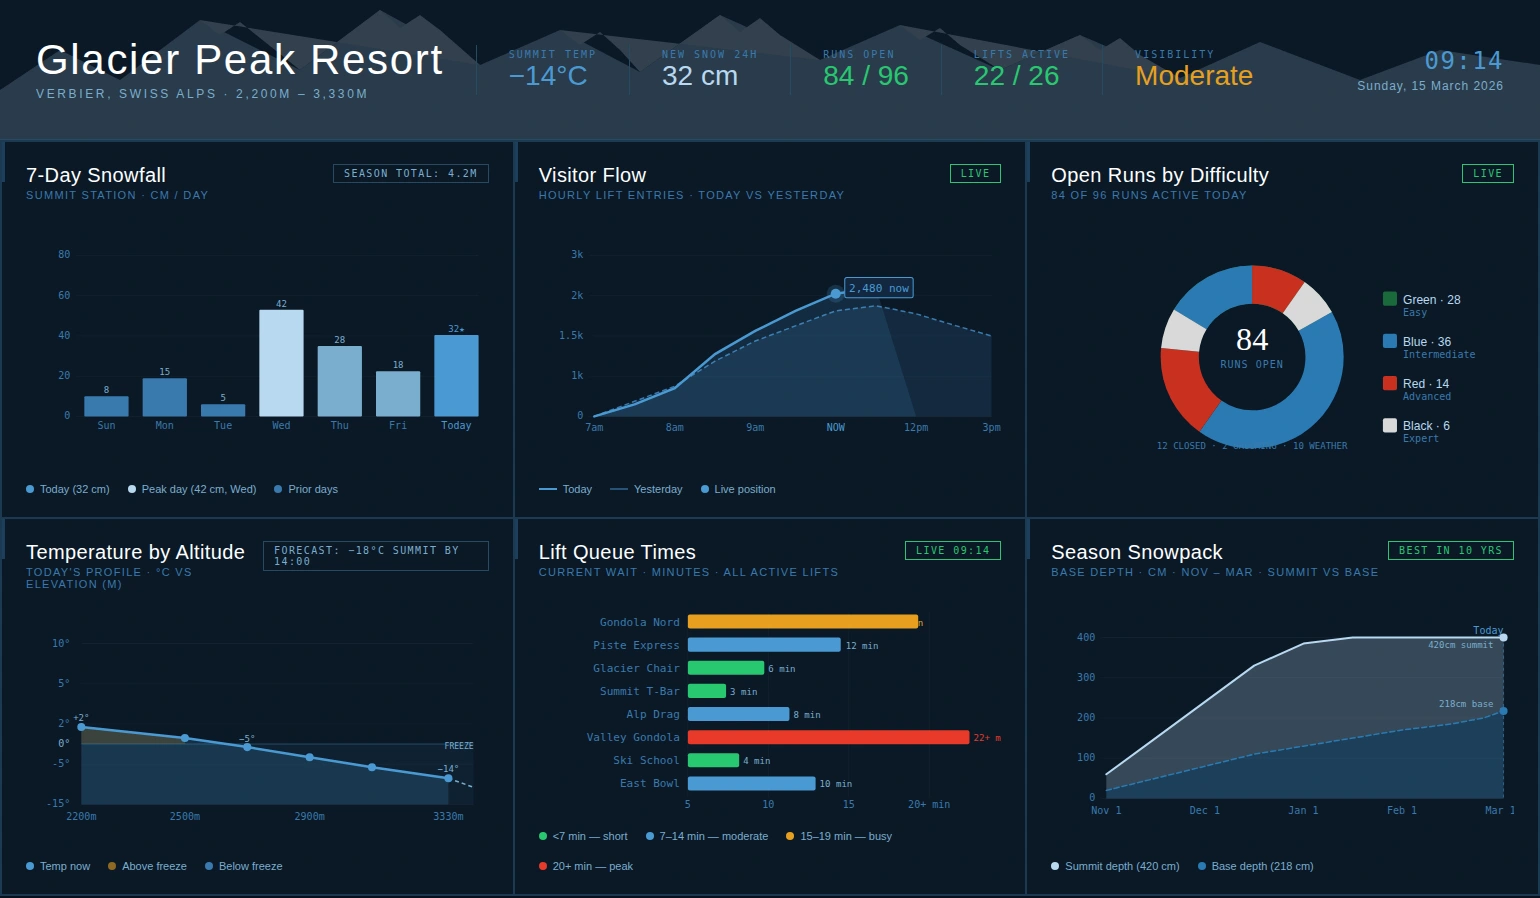
Following the implementation of InetSoft, the resort has seen improvements in operational responsiveness and data accessibility. Mountain operations teams can monitor lift status, snow grooming activities, and weather changes in real time, allowing for swift operational decisions that improve safety and guest experience.
The marketing and sales teams benefit from detailed customer analytics and trend reports that inform targeted promotions and pricing strategies. Executives have access to consolidated views of financial, operational, and customer experience metrics, supporting strategic planning and resource allocation.
The design of InetSoft’s dashboards supports non-technical users in exploring data independently, promoting a culture of data-informed decision-making across the organization. This broad access to insights expedites problem-solving and encourages innovation.

Challenges Encountered and Lessons Learned
The upgrade process presented challenges typical of software transitions. Data migration required careful validation to maintain accuracy. Users needed time and support to adapt to the new interface and fully utilize its capabilities.
Clear communication about the benefits and practical applications of the new system was vital to encourage adoption. Involving end users early in dashboard design helped ensure the solution met actual needs, increasing satisfaction and utility.
Future Directions
With InetSoft established, the resort plans to explore advanced analytics techniques such as predictive modeling and machine learning to further enhance operations. Future initiatives include integrating Internet of Things (IoT) devices for detailed real-time monitoring and developing mobile-friendly dashboards for staff working in the field.
This upgrade is part of the resort’s broader digital transformation strategy, aimed at improving operational efficiency, enhancing guest experiences, and maintaining competitiveness in the evolving ski industry.
Strategic Enhancement of Data Analytics Capabilities
The transition from Pendio.io to InetSoft represents a strategic enhancement of the ski resort’s data analytics capabilities. By adopting a more powerful and flexible platform, the resort has strengthened its ability to respond quickly to operational challenges, deliver customized insights to diverse teams, and foster a culture of informed decision-making. This shift positions the resort to capitalize on emerging technologies and analytics advancements, supporting continued growth and operational excellence.

More Articles About Interactive Dashboard Software
Interactive Report Data Searches - InetSoft's award winning reporting software allows users to mine data with powerful data search tools that can summon massive amounts of information within seconds. Searching is another way to quickly find the information you want. StyleBI allows you to search a report in either Basic or Advanced mode. The 'Interactive' report will be used to illustrate these features. 1. Open the 'Search' panel with the 'Search' button on the Report Portal toolbar. You can also use 'Report Explorer' > 'Browse/Search' > Search tab. 2. Enter “George” in the 'Search for:' textbox, and click 'Search' to find all occurrences in all of the elements of the report. The 'Browse/Search' panel will list the locations of the searched term, and all results will be outlined in a red dotted line in the report. When you select one of the instances of the search, the report will jump to the appropriate page, and the result will be outlined in a bold, dotted red line. 3. Let's do an 'Advanced Search'. First, drill down (click) on the year 2006 bar in the 'Revenue by Year' chart. This lists the orders for 2006. 4. Open the 'Search' panel, then click the 'Advanced' button to open the advanced search options...
Interactive Report Explorer - Using the report explorer in InetSoft's award winning reporting software, end-users can customize data elements to create a flexible and powerful reporting solution. Features of the Report Explorer are greatly determined by the nature and complexity of the original report design. For example, complex crosstab tables (Formula Tables) cannot be manipulated within the Report Explorer, and Section elements do not permit column rearrangement and/or hiding. There are two ways to set filter conditions on data in a report. Here we demonstrate using the Report Explorer. An alternate way is with Ad Hoc reporting tool (discussed in the Ad Hoc Reporting). Our example uses the 'Interactive' report. The following example shows you how to filter data using Report Explorer, again using the 'Interactive' report. 1. Open the Report Explorer, select the 'Geography' element, and click the 'Show Filter Options' button in the 'Browse/Search' panel toolbar. 2. In the drop-down to the right of 'Total', select '>' and type “1000000” in the text box to the right. Click 'Filter'...
Interactive SharePoint Dashboards - Are you looking for a good solution for interactive SharePoint dashboards? InetSoft's pioneering dashboard reporting application produces great-looking web-based dashboards with an easy-to-use drag-and-drop designer. Get cloud-flexibility for your deployment. Minimize costs with a small-footprint solution. Maximize self-service for all types of users. No dedicated BI developer required. View a demo and try interactive examples...
Interface with REST API for Reporting - Looking for a reporting platform that connects to a REST API? InetSoft's pioneering dashboard reporting application does and enables secure interactive reports and analytics. View a demo and try interactive examples...
Internet of Things Dashboard Maker - The user interface of an IoT platform known as an IoT dashboard allows users to monitor and communicate with connected devices using graphs, charts, and other UI components. By visualizing the data from your connected devices, dashboards let you take control of every element of your connected devices and get perspective on your surroundings. Users may easily personalize their dashboards without impairing the processing of device data since IoT dashboards lie on top of the essential functionality offered by an IoT platform. They may transfer IoT data to their own tools for graphical data visualization, reporting, analytics, CRM, etc. in addition to employing dashboards. Companies are now understanding that the ability to use IoT Dashboards to remotely monitor equipment will increase their resource efficiency and their capacity to provide more value to their consumers. The next question is, "How does an organization gain this capability?...

Interoperable and Dynamic Dashboards - How interoperable or how dynamic are dashboard becoming when it comes down to being able to mix and match data sets, and grab information very quickly without going back to your IT people or your software people or whatever? It’s a big trend. A lot of people talk about it. I mean the reality is it’s still difficult to do with the traditional BI tools that have been out there. We see that with a lot of our customers where they are struggling with these old BI tools and accessing the data sources they have. They look for software like ours to solve these problems and really deliver on this self-service BI concept. The technology is there to make this easier and easier. We were moving to the ability for savvy users to be able to gather information on the fly, to take advantage of apps that have been created for mash ups. You may find that you have 2,000 KPIs the company tracks, so you have two thousand different dimensions available in the design tool. But that’s not what the true spirit of a KPI is...

Intervals Dashboarding Tool - Looking for a good solution for Intervals dashboarding? InetSoft's pioneering BI application produces great-looking dashboards that mashup time tracking data with other enterprise data sources. View a demo and try interactive examples...
Intranet Dashboard Examples - Looking for dashboards your employees can access over company intranet? While InetSoft's web based BI tools are cloud ready, they can just as easily be deployed on a single server on premise..
Intuitive Dashboard - An intuitive dashboard affords end-users with a large learning curve that is non-existant in most brand name business intelligence applications. Users possessing minimal technical abilities will be able to take advantage of in analytic depth features while they are first learning to use the program. A Data Tip displays information about the current region using another Viewsheet component, such as a chart or a gauge. The data tip component displays data only for the particular region over which the user hovers the mouse. In this example, you will create a map that displays quantity purchased by state. When the user hovers the mouse over a given state, the map will display a chart as a Data Tip. This chart will break down the quantity purchased by the individual companies within that state. 1. Create a new Viewsheet based on the sample ‘US Sales’ Worksheet. 2. Drag a Chart element onto the Viewsheet grid. (This will be the Data Tip chart.) 3. Click the center of the Chart (or click the ‘Edit’ button at the topright). This opens the Chart Editor. Make the following selections...

Inventory Management Dashboard Software - Researching good inventory management dashboard software? InetSoft's pioneering BI application produces great-looking dashboards that maximize self-service for managers and analysts. View a demo and try interactive examples...
Investor Relations Dashboards KPIs - A company's connection with its shareholders, future investors, and the financial community is crucially influenced by investor relations (IR). Investor relations dashboards are now crucial tools for giving stakeholders a succinct but thorough picture of a company's performance in the digital era. These dashboards' key performance indicators (KPIs), which provide helpful insights into many business elements, are their basis. This article explores the key KPIs used on investor relations dashboards and how they aid in making well-informed decisions. Perhaps the most important KPIs on investor relations dashboards are financial metrics. Investors can clearly see a company's profitability and financial stability via metrics like sales growth, earnings per share (EPS), and net profit margin. These indicators are often shown graphically to illustrate patterns over certain time periods and to assist in the evaluation of a company's financial health...
Invoicing Dashboard Tool for FreshBooks - Looking for a good solution for FreshBooks dashboard reporting? InetSoft's pioneering BI application produces great-looking cloud-based dashboards with an easy-to-use drag-and-drop designer. Mashup your finance data with other enterprise sources for a complete picture of performance. View a demo and try interactive examples...

IoT Dashboard Design - It turns out that the Internet is uncontrollable. We are transitioning from desktop computers, cell phones, and outdated routers into a new age known as the Internet of Things. Numerous home objects have been developed that can link to the Internet, including cars, watches, dog collars, and refrigerators. All of this is done in order to examine distinct client demands using their data. In this post, we'll look at how to utilize the data the Internet of Things produces, why it should be analyzed, and then what resources to use to create our own IoT dashboards. Building IoT dashboards is done for a number of purposes, including: Automatically add location, time, weather, temperature, and other external elements specific to your consumers to incoming data from your equipment...
IoT Dashboard Platform - Are you looking for a good IoT dashboard platform? InetSoft's pioneering dashboard reporting application produces great-looking web-based dashboards with an easy-to-use drag-and-drop designer. Analyze sensor data, run ML models, and visualize results. Get cloud-flexibility for your deployment. Minimize costs with a small-footprint solution. Maximize self-service for all types of users. No dedicated BI developer required. View a demo and try interactive examples...
iPad Business Intelligence Dashboards - Since 1996, InetSoft has been delivering business intelligence solutions to developers and enterprises worldwide. InetSoft's StyleBI™ has always been mobile friendly. StyleBI employs a deploy everywhere approach. It depends on the level of interactivity and frequency of use; you might prefer to design an iPad version of a dashboard that had originally been created for the desktop. You can customize it for all of your enterprise, for all users. It's easy, agile, and robust. The proliferation of mobile devices has grown in enterprises across the country. For as many new devices there are available, the application for our software in any industry is limitless. Here are some examples of popular applications of business intelligence being used in a mobile environment...
Issue Tracking Dashboard for Smartsheet - Looking for a good solution for Smartsheet dashboard reporting? Create more interactive views of your product development projects and issue tracking. Maximize self-service. InetSoft's pioneering BI application produces great-looking cloud-based dashboards with an easy-to-use drag-and-drop designer. View a demo and try interactive examples...
IT Dashboards and Templates - Do we have actual downloadable IT dashboards and templates? And does the whitepaper show how any IT pro can sit down with their systems center infrastructure and design this IT dashboard system and build it out? So we didn’t want to just leave it at whitepaper because there were a lot of findings, a lot of really good hints that we came up with. We figured out that extracting information from this data warehouse might not be necessarily transparent to most IT pros if you don’t have an understanding or workings of the system. We laid that all out in this whitepaper, but then we have gone the extra step and packaged up some of these preconfigured ETL packages, the dashboards, the cubes so that with a one pager, install instruction type of manual, an IT pro can get it up and running, see what's there, what's possible, get some immediate value. And then in the whitepaper if they want to expand it out, grow it to meet their individual needs, then they can do that in a expedited way. The IT manager is going to have a better understanding of how his IT department is performing, if it’s optimized, as well as being able to track things such as service level agreements...
ITSM Dashboard Application - Are you looking for a good ITSM dashboard application? InetSoft's pioneering dashboard reporting application produces great-looking web-based dashboards with an easy-to-use drag-and-drop designer. Get cloud-flexibility for your deployment. Minimize costs with a small-footprint solution. Maximize self-service for all types of users. No dedicated BI developer required. View a demo and try interactive examples...