Evaluate InetSoft's Tool for Making New Database Reports
Do you need to generate pixel-perfect paginated reports for scheduled distribution or self-service drill-down usage via a Web portal? Do you want to report information in dashboards or scorecards, or want to offer point-and-click visual analysis? View a demo and try interactive examples.


Register for more information and a personalized demo
About InetSoft
Since 1996 InetSoft has been delivering easy, agile, and robust business intelligence software that makes it possible for organizations and solution providers of all sizes to deploy or embed full-featured business intelligence solutions. Application highlights include visually-compelling and interactive dashboards that ensure greater end-user adoption plus pixel-perfect report generation, scheduling, and bursting. InetSoft's patent pending Data Block™ technology enables productive reuse of queries and a unique capability for end-user defined data mashup.
This capability combined with efficient information access enabled by InetSoft's visual analysis technologies allows maximum self-service that benefits the average business user, the IT administrator, and the developer. InetSoft was rated #1 in Butler Analytics Business Analytics Yearbook, and InetSoft's BI solutions have been deployed at over 5,000 organizations worldwide, including 25% of Fortune 500 companies, spanning all types of industries.

More Resources and Articles about InetSoft's Tool for Making New Database Reports
Access the Report Servlet - The ServletRepository generates DHTML output according to the parameters in HTTP requests. The parameters are embedded in the generated DHTML and are normally not used directly by an application to access the servlet...
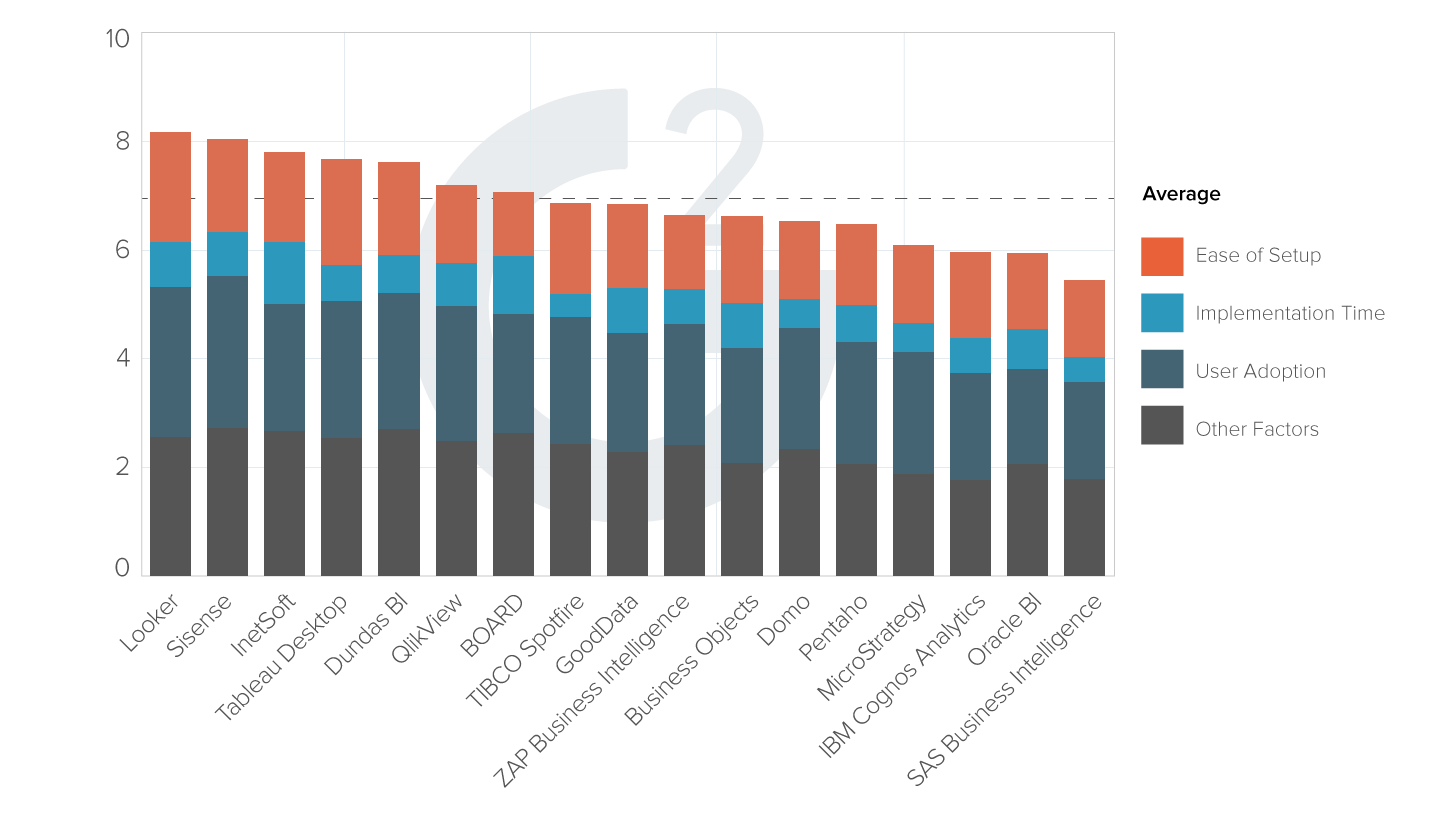
| #1 Ranking: Read how InetSoft was rated #1 for user adoption in G2's user survey-based index | Read More |
API for the Appearance of a Dashboard Chart - You can change the static appearance of dashboard chart elements by using a static VisualFrame. For example, you can set static colors, sizes, and textures to enhance the aesthetic appearance of a chart...
Collection of Popular Business Dashboard Examples - Below are screenshots of business dashboard examples built with InetSoft's drag and drop dashboard software. Click on the screenshots to get a closer look...
Controlling Company Dashboard Assets - When you drag an asset from the Asset Repository into a Worksheet, the imported asset is a copy that remains linked to its own defining Worksheet. When you make changes to the original asset, the changes are propagated to all linked copies. This default behavior is called "Auto Update...
Create an Interactive Business Dashboard - With report creation, again it's for when you need to create pixel-perfect paginated reports that are either sent out in PDF format or for people to come in to your portal to view, you can do that with our report designer...
 |
View live interactive examples in InetSoft's dashboard and visualization gallery. |
Custom Analytic Dashboard Product - The ability to create a custom analytic business dashboard allows you to view data in new and insightful ways that are relevant to your industry while keeping ahead of the competition. See the examples below for more information...
Customized Self Service Dashboards - Unlike other BI software offerings, InetSoft's dashboards can be easily customized by end users. This lowers the cost of owning the software because expensive business intelligence experts are not required...
Dashboard Display Information - The way information is displayed has great affect on comprehension. InetSoft's dashboard display is fully customizable, allowing you to format information however you feel is best suited for your needs...
Easy Embedded Reporting Software - InetSoft provides a reporting application that is well-suited for another ISV or SaaS provider to use for embedding reports into their own applications. The report generator provides production, interactive, and ad hoc reports in a zero client, Web-based environment...
 |
Read the top 10 reasons for selecting InetSoft as your BI partner. |
Easy Way to Create New Visualizations - Today's business users are looking for quick and easy ways to create new reports or visualizations of their data. Rather than the old model of giving time and resource consuming requests to database analysts, IT and business managers are looking for self-service functionality to meet the demands for impromptu reports...
Export a Dashboard to HTML - HTMLGenerator is used to export a report in HTML format. If the report contains images, the images can be converted to JPEG or PNG format. It is also possible to create an HTML bundle. In this case, the HTML and related images are bundled together into a zip file...
Grouping Data in a Dashboard - End users have the ability to group data from disparate formats and combine them into a sophisticated visual report using InetSoft's award-winning dashboard software. View the example below to learn more about the StyleBI solution...
How to Control Dashboard Features - To alter the appearance of chart axes, use the Chart's setScale() method to assign a new Scale object. For example, you can replace a linear scale with a logarithmic scale, show or hide tick marks, display axis labels at top or right, change the label font and color, etc. Consider the following example...
Read what InetSoft customers and partners have said about their selection of Style Report as their production reporting tool. |
InetSoft's Agile Manufacturing Dashboard System - Looking for a manufacturing dashboard system that is agile and robust? InetSoft makes dashboard software that is easy to deploy and easy to use, and its unique data mashup capabilities enable unified views of corporate performance and maximum self-service...
Interactive Dashboard with Maximum Self-Service - InetSoft's interactive dashboard is a unique and innovative approach to business intelligence that allows you to customize the way your data is displayed. View the example below to learn how InetSoft's StyleBI can have an immediate and lasting impact on your business...
Java Report Localization API - StyleBI conforms fully to the standard Java localization API, such as date and number formatting. The InetSoft class library itself does not embed hard-coded text strings in report elements...
Read what InetSoft customers and partners have said about their selection of Style Scope for their solution for dashboard reporting. |
Key Performance Indicators Dashboard Demo - InetSoft's dashboards are channels for all end users to focus on the information and measures that are most crucial to them. For example, it is important to know how much sales for the quarter are, but what if a manager needed to choose a sales person to make a pitch? With InetSoft's drill down capabilities, users can quickly spot who had the best sales consistently, or even compare quality of sales...
Looking for an Efficient Reporting Solution - InetSoft's Style Report is the answer to all of your organizational reporting needs. This web-based reporting interface gives a variety of options for displaying data clearly and efficiently, making it easier for your organization to track its progress on a variety of initiatives...
Objects for Use with Interactive Dashboards - A Tab element advances the printing to the next tab stop. The Tab element also serves as the superclass of the Text Object : The properties defined in the Tab element are also available in a Text element for controlling the behavior of tabs in the text string...
Searching for Dashboard Template Examples - Below are dashboards templates designed using InetSoft's drag and drop dashboard solution, some of which can be tested with the free downloadable 5-day evaluation copy of Style Intelligence, while others can be seen in the free visualization tool, Visualize Free. Click on an image below to enlarge the dashboard. When done, click anywhere to return...
 |
Learn how InetSoft's data intelligence technology is central to delivering efficient business intelligence. |
Sophisticated Business Dashboard Software - InetSoft's business dashboard software has been designed to be easy to deploy, easy to use, and easy to administer. The application was designed with the average business user in mind. Since 1996 InetSoft has been offering business intelligence applications that are flexible and powerful, serving over 5,000 enterprises and solution providers worldwide...
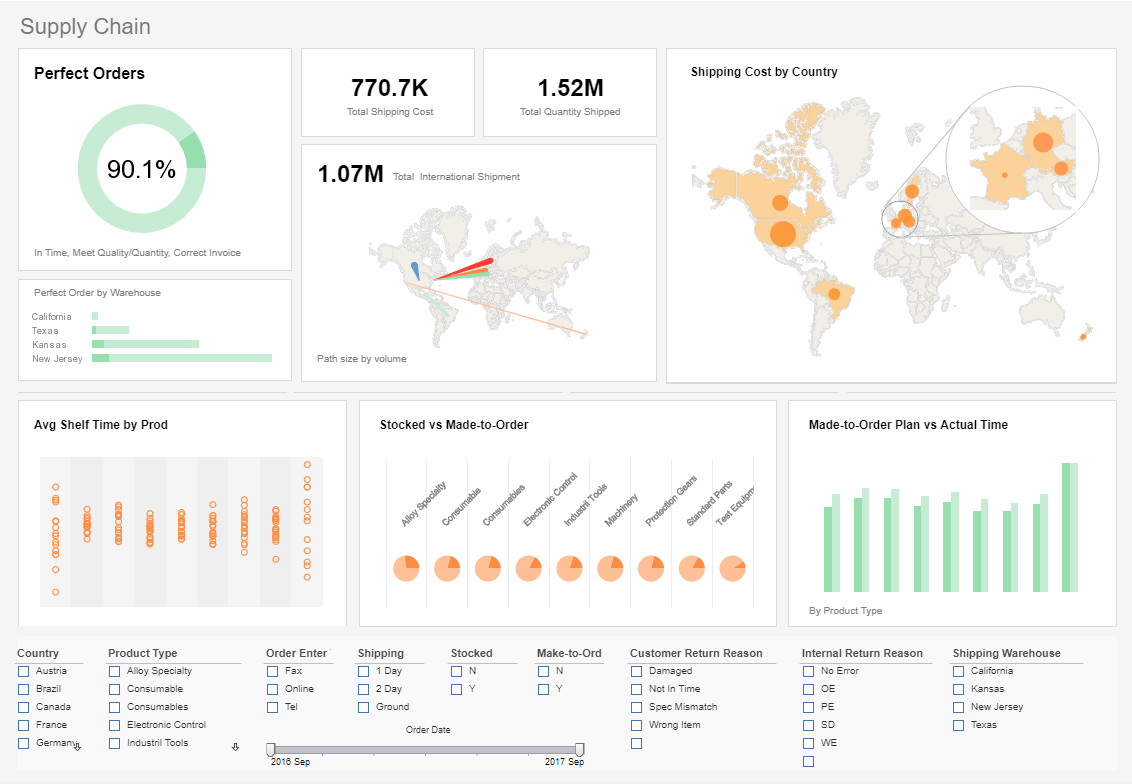
Supply Chain Management Dashboard Example - More than ever, large organizations need to be aware of all the elements within their increasingly complex supply chains. InetSoft's BI Dashboards make this task far more manageable than ever before by consolidating information from seemingly disparate sources. View the example below to learn how you can benefit from our BI Solutions...
Transform and Mashup Disparate Data - InetSoft's dashboard software provides a sophisticated tool known as a data worksheet that allows users to manipulate, transform, and mashup disparate data sets. View the example below to learn more about the StyleBI solution...
Try InetSoft's Dashboard Report Solution - Are you looking for the best dashboard report solution? Since 1996 InetSoft has been making dashboard software that is easy to deploy and easy to use. Build self-service oriented dashboards quickly. View a demo and read customer reviews...


