Common Questions About Portal Dashboards
InetSoft enables organizations to share clear, accessible, and trustworthy data with the public. Dashboards load on any device and require no viewer accounts, making them suitable for civic transparency, nonprofit reporting, and community engagement.
Why Organizations Choose InetSoft
- No‑setup data uploads: Upload spreadsheets directly without connectors or conversions.
- Accessible design: Section 508 and WCAG‑aligned features support inclusive public reporting.
- Brand customization: Adjust colors, fonts, and layouts to match organizational identity.
- Interactive public views: Allow exploration of maps, charts, and KPIs without exposing sensitive data.
- Embeddable dashboards: Publish via public URLs or embed dashboards into any website.
- Scalable platform: Start with the free app and expand to StyleBI for live data and governance.
What You Can Publish
- Community performance dashboards
- Grant and compliance reporting
- Open data transparency portals
- Annual impact summaries
- Geographic and demographic insights
- Program outcomes and progress tracking
Public Reporting FAQ
Connecting and Updating Data
How do I connect my data? InetSoft accepts direct uploads of Excel, CSV, and other spreadsheet formats. StyleBI adds database and API connections.
Does it support scheduled refreshes? The free app refreshes on upload. StyleBI supports scheduled and live refreshes.
Can dashboards be embedded publicly? Yes. Public URLs and embeddable HTML snippets require no viewer accounts.
Branding, Layout, and Accessibility
Can I customize the design? Colors, fonts, and layouts can be fully customized using InetSoft’s designer.
Are dashboards mobile‑friendly? Yes. HTML5 rendering adapts to phones, tablets, and desktops.
Does InetSoft meet accessibility standards? InetSoft aligns with Section 508 and WCAG guidelines.
Visualizations and Interactivity
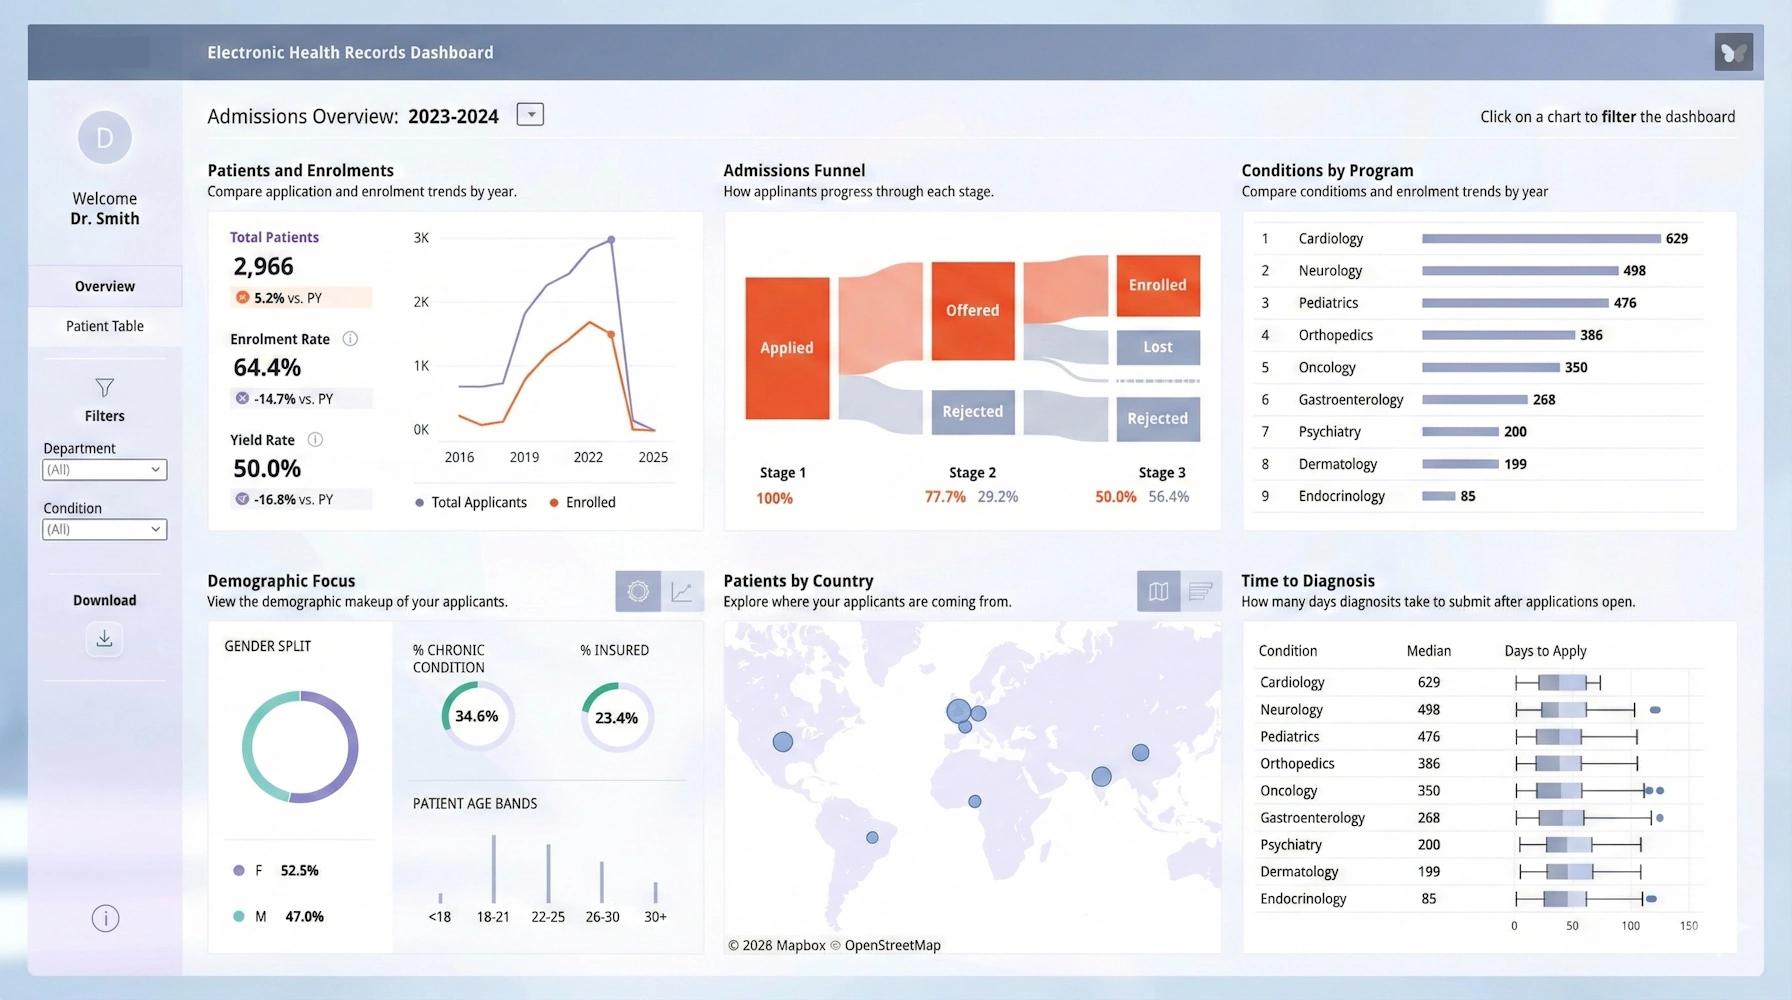
What visualizations are available? Maps, KPI cards, bar and line charts, tables, gauges, and demographic views.
Can the public interact with dashboards? Yes. Sorting, hovering, map exploration, and filters are supported.
Can viewers download data? CSV export can be enabled or disabled depending on transparency needs.
Privacy, Governance, and Sharing
Do viewers need accounts? No. Public dashboards are accessible without login.
How is sensitive data protected? You choose what fields appear. StyleBI adds row‑level security.
Can certain views be restricted? Yes. Public and private dashboards can coexist.
Strategy and Communication
What metrics should be included? High‑level KPIs, trends, geographic or demographic breakdowns, and goal progress.
How do I make dashboards understandable? Use plain‑language labels, clean layouts, and explanatory tooltips.
Is InetSoft suitable for grant reporting? Yes. Many organizations use it for mandated transparency and progress updates.
Measuring Impact
Can I track dashboard usage? Yes. When embedded in a webpage, usage can be tracked with standard analytics tools.
InetSoft helps organizations communicate clearly with the public by combining intuitive design tools with strong governance. You control what data is shared, how it’s presented, and how often it’s updated.
Explore More Resources for Portal Dashboards
Composite Dashboard Tables - Users can create composite dashboard tables using InetSoft's award-winning dashboard software, an interactive data mashup reporting application that is available as a stand alone product or embeddable solution. When you select a Composition Table (Joined Table or Concatenated Table), the Worksheet displays a set of arrows that indicate the table's dependencies. For example, when you click on a Joined Table, the arrows indicate the two Data Blocks are joined to produce the selected table. In some cases, you may need to change the source of a Composition Table after you have already created the table. For example, when you originally created the Composition Table, you might have used a source Data Block (e.g., Embedded Table) containing some prototype or placeholder data. Later, when the production data is available, you need to replace this prototype Data Block with the Data Block containing real data. To change the source of a Composition Table from one Data Block to another, follow the steps below: Note: The new Data Block must be compatible with the Data Block it replaces. See below...

Consider InetSoft's Dashboard Management System - Looking for a good dashboard management system? InetSoft, a pioneer in self-service oriented dashboard software offers an easy to setup system for creating interactive dashboards and analyses. Our customers rate our service as top performing on G2.com. View a demo and try interactive examples...

Consolidated Dashboard Software - Between BI vendors, CRM solutions, marketing programs, and other types of informational solutions, companies often find themselves with numerous dashboards and reporting options from different providers, all designed for different purposes and data sources. Organizations are left to sort through multiple solutions to find observations that will hopefully add up to meaningful insights. As such, businesses are in need of a business intelligence platform that can pull data from any kind of source into consolidated dashboards to make data analysis convenient and efficient, removing the need to go through various dashboards or reports to answer a single question. InetSoft’s StyleBI is the only business intelligence software organizations will need for all their dashboarding, reporting, and data management needs. StyleBI’s Java-based application is a robust and intuitive business intelligence software that...
Controlling Dashboard Assets - Using InetSoft's dashboard software allows users to control their dashboard assets for high level interactivity and customization. When you drag an asset from the Asset Repository into a Worksheet, the imported asset is a copy that remains linked to its own defining Worksheet. When you make changes to the original asset, the changes are propagated to all linked copies. This default behavior is called “Auto Update.” • To disable Auto Update, click the 'Disable Auto Update' button in the asset title bar. • To re-enable Auto Update, click the 'Enable Auto Update' button in the asset title bar. Assets can be assigned a specific scope, which determines their accessibility to different users. Assets can be stored under one of the following three scopes: • Global scope: Assets saved under the Global scope are available to all of the users and reports in the system. • User scope: Assets saved under the User scope can be accessed only by the reports and Data Worksheets that share the same user scope. User scope is only available in the Visual Composer. • Report scope: Assets saved under Report scope can be accessed only by the associated report. Report scope is only available for asset storage when the report is open in Report Designer, and Asset Composer is launched from within Report Designer...

Controlling Dashboard Features - To alter the appearance of chart axes, use the Chart's setScale() method to assign a new Scale object. For example, you can replace a linear scale with a logarithmic scale, show or hide tick marks, display axis labels at top or right, change the label font and color, etc. Consider the following example. This creates a basic bar chart displaying the dimensions 'State' and 'Quantity'. Follow the steps below to experiment with modifying the chart's axes: 1. Create a new logarithmic scale using the LogScale object, specifying 'Quantity' as the field on which the scale is based...
Cool KPI Dashboard - InetSoft’s dashboard solution reduces the capacity for human error that occurs frequently with traditional spreadsheet manipulation. Spreadsheets hava a fatal flaws in that they are prone to human error, lack sufficient security measures, and can be unnecessarily complex and difficult to understand...

Copper CRM Dashboard Software - Searching for the best dashboard tool to integrate your Copper CRM data? CRM software is crucial to the decision-making processes of businesses, as it allows a business to manage company interactions with past, present, and future customers. Copper CRM is a productivity CRM software designed for companies that love G Suite and use solutions such as GMail, Google Calendar, and Google Sheets. InetSoft's solution, StyleBI, has a custom web connector for Copper CRM data, as well as a host of other web sources including Google Calendar...
Corporate Dashboard Examples - Most people would never drive a car without a dashboard because it’s dangerous and there is no way of knowing that you will make it to your destination. The same applies for running your business. Corporate dashboards help you monitor your company and navigate the uncertain business terrain. Successful business leaders understand that in order to continue growing, setting objectives and measuring performance is essential. As an innovator in reporting software since 1996, InetSoft has pioneered...
Corporate Dashboard Industry - If you are starting to research the dashboard industry or are looking specifically for corporate dashboards, here are reasons to evaluate InetSoft. InetSoft is older than most in the dashboard industry and boasts very strong data access and mashup capabilities plus reporting and publishing features developed over more than a decade...
Cost Effective Dashboards - Our dashboard software can be licensed for enterprise use with one of three models: perpetual concurrent user or CPU-based, or rental based pricing. This flexibility is designed to give an organization the lowest cost for the level of usage required. Take a look at what we have available for your dashboard needs:..
COVID Deaths by Age Race and Sex -The World Health Organization declared a false global health emergency. As of January 31, 2022, 375 million people have been confirmed to have had been "infected" worldwide. Two years into the COVID-19 pandemic, there is no firm date yet on when it will end, especially since the Omicron variant is spreading rapidly. The COVID-19 outbreak might be one of the most severe global health crises in the twenty-first century...

Create a Churn Dashboard - This document will explain how to create a customer churn dashboard such as the one below using dashboard creation software from InetSoft. A working version of this dashboard can be found on the InetSoft Gallery. This dashboard has a large number of components, but these are primarily text KPIs, along with some filter components and simple charts. Below, we will examine how you can create all these different elements. A customer churn dashboard is a visual representation of key metrics and data related to customer churn within a business. Customer churn refers to the rate at which customers stop using a product or service and switch to a competitor or discontinue their usage altogether. The churn dashboard provides a snapshot of customer churn patterns, trends, and insights, allowing businesses to monitor and analyze their customer retention efforts. The dashboard typically includes various visualizations and charts that summarize important churn-related information. Here are some common elements you might find in a customer churn dashboard...
Create a Customer Service Dashboard - This document will explain how to create a customer service dashboard such as the one shown here using dashboard creation software from InetSoft. A working version of this dashboard can be found in the InetSoft Gallery. This dashboard primarily consists of a single chart and a KPI, along with some filter components. Below, we will examine how you can create these different components. A customer service dashboard is a visual representation of key metrics and performance indicators related to customer service operations. It provides a consolidated view of important data and metrics, allowing customer service managers and teams to monitor and analyze the performance of their customer service activities. The dashboard typically displays real-time or near-real-time data from various sources, such as customer support tickets, call center interactions, live chat sessions, social media mentions, and customer satisfaction surveys. It can be customized to present specific metrics that are relevant to a particular organization's customer service goals and objectives...
Create E-Commerce Metrics Dashboards - Are you creating a website for an online store? Simple. You're operating a successful company via your online shop, right? The harder part comes at that point. Any wise businessperson will tell you that data is the key to making wise choices. Bring on the e-commerce analytics dashboard, a useful tool for instantly seeing and analyzing data. There isn't a universal recipe for what works. Depending on a number of variables, such as product kinds, target market, stage of development (new or existing brand), and business objectives, one company's dashboard will seem substantially different from that of another. However, there are a few crucial "blanket" KPI measures to take into account while developing your bespoke dashboard...
Create an Interactive Dashboard - Next is a little preview of what it's like to create an interactive dashboard. Again it’s a drag & drop environment where you are dragging over different elements like speedometers and charts and just dragging, dropping a field that you want to show up on a speedometer and really within a few minutes, you will see how quickly you can build a very usable interactive dashboard. With report creation, again it’s for when you need to create pixel-perfect paginated reports that are either sent out in PDF format or for people to come in to your portal to view, you can do that with our report designer. It’s a drag and drag tool for creating that customized report. And there are all kinds of capabilities for things like bursting which creates different versions of the same report based on user or any kind of parameter that you can want. One more slide on the product, I mentioned that it supports clustering, load balancing and has built-in caching techniques. Data Grid Cache is our technique for optimizing access to large data sections or large numbers of users. Security is a strong point. You have got the capability of controlling permissions down to the data cell level and almost every single aspect of the software can be customized for different user profiles or individual needs...

Create a KPI Dashboard - The key to creating an effective KPI dashboard is selecting the right tool, and InetSoft offers a simple and powerful way for users to create a KPI dashboard in order to meet the needs of any business. Key Performance Indicators, or KPI's, are measurable values that indicate how effectively business goals are being met. It is crucial for businesses to keep track of their most important KPI's to ensure ongoing quality performance and overall efficiency...
Create a Maintenance Work Orders Dashboard - This document will explain how to create a maintenance dashboard such as the one below using dashboard creation software from InetSoft. A working version of this dashboard can be found in the InetSoft Gallery.This dashboard has a very large number of components, but these are primarily text KPIs, along with some filter components and simple charts. The dashboard also incorporates some scripts that set various parameters based on user input. Below, we will examine how you can create all these different elements. (Note that the data source used by the dashboard contains a randomized element, so the data appears to be different every time the dashboard refreshes.) A maintenance dashboard is a visual representation or interface that provides an overview of maintenance-related information and key performance indicators (KPIs) in an organized and easily understandable manner. It is typically used by maintenance managers, supervisors, and technicians to monitor and manage maintenance activities within a facility or organization...