Evaluate InetSoft's Airtable Reporting Tool
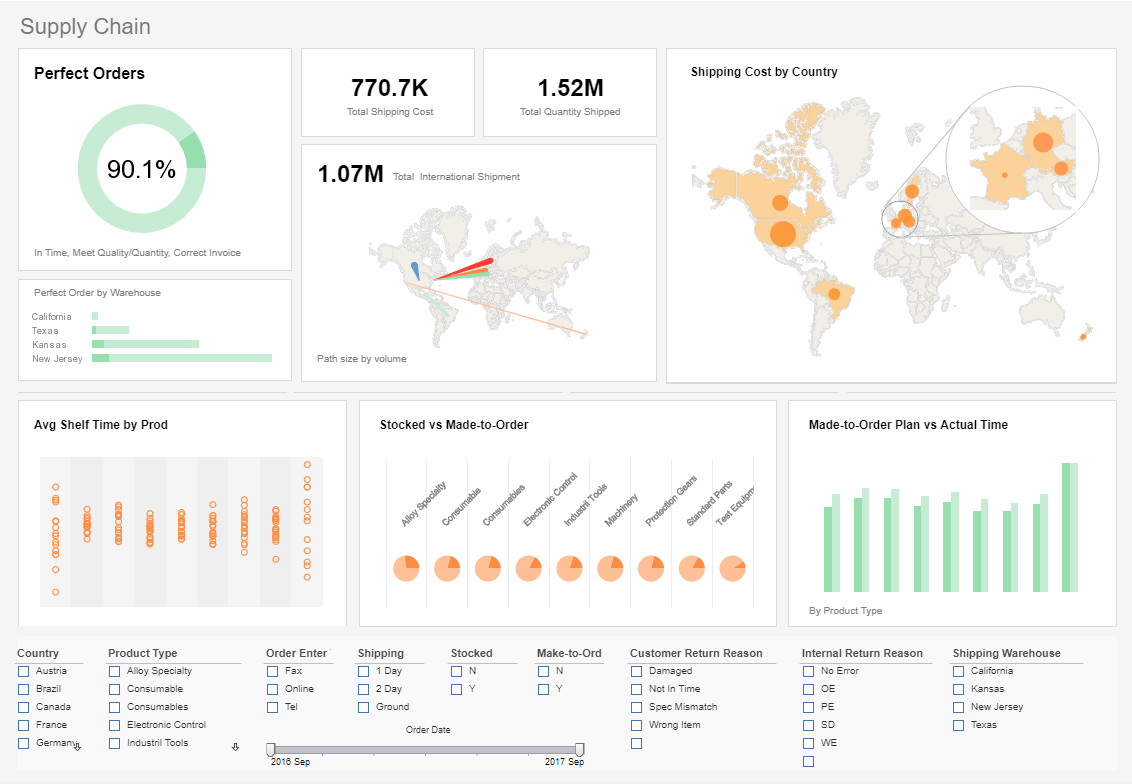
Are you looking for a good solution for Airtable dashboard reporting? InetSoft's pioneering BI application produces great-looking cloud-based dashboards with an easy-to-use drag-and-drop designer. View a demo and try interactive examples.


Register for more information and a personalized demo
About InetSoft
Since 1996 InetSoft has been delivering easy, agile, and robust business intelligence software that makes it possible for organizations and solution providers of all sizes to deploy or embed full-featured business intelligence solutions. Application highlights include visually-compelling and interactive dashboards that ensure greater end-user adoption plus pixel-perfect report generation, scheduling, and bursting. InetSoft's patent pending Data Block™ technology enables productive reuse of queries and a unique capability for end-user defined data mashup.
This capability combined with efficient information access enabled by InetSoft's visual analysis technologies allows maximum self-service that benefits the average business user, the IT administrator, and the developer. InetSoft was rated #1 in Butler Analytics Business Analytics Yearbook, and InetSoft's BI solutions have been deployed at over 5,000 organizations worldwide, including 25% of Fortune 500 companies, spanning all types of industries.

What Are the Drawbacks of the Dashboard Tool Included with Airtable?
Airtable's built-in dashboard tool offers users a convenient way to visualize and track data from their databases. While it provides several benefits, such as ease of use and integration with existing workflows, there are also some drawbacks to consider. Here are some of the limitations and drawbacks of the dashboard tool included with Airtable:
-
Limited Customization Options: Airtable's dashboard tool has limited customization options compared to dedicated data visualization tools. Users may find it challenging to create highly customized and visually appealing dashboards tailored to their specific needs and preferences.
-
Limited Chart Types: The range of available chart types in Airtable's dashboard tool is limited compared to specialized data visualization tools. Users may not find advanced chart types or visualization options, limiting their ability to represent data in the most suitable format.
-
Limited Data Sources: The dashboard tool in Airtable primarily relies on data stored within Airtable databases. Users may encounter limitations when trying to integrate data from external sources or other platforms, restricting the scope of their dashboards.
-
Limited Interactivity: Airtable's dashboard tool may lack advanced interactive features found in dedicated data visualization tools. Users may not be able to incorporate interactive elements such as drill-down functionality, filters, or dynamic data selection, limiting user engagement and exploration.
-
Scalability Issues: As datasets grow larger or more complex, users may experience performance issues or limitations when creating dashboards in Airtable. Large datasets or frequent updates may impact dashboard loading times and responsiveness.
-
Limited Sharing Options: While Airtable allows users to share dashboards with collaborators, the sharing options may be limited compared to dedicated dashboarding platforms. Users may encounter restrictions when sharing dashboards with external stakeholders or embedding them into external websites.
-
Dependency on Airtable Ecosystem: Users who rely heavily on Airtable for data management may find themselves limited by the platform's ecosystem. Integrations with external tools or platforms may be limited, making it challenging to extend the functionality of dashboards beyond the Airtable environment.
-
Data Security and Compliance Concerns: Users handling sensitive or regulated data may have concerns about data security and compliance when using Airtable's dashboard tool. Limited control over data access and permissions may pose risks in certain industries or organizations with strict data governance requirements.
-
Cost Considerations: While Airtable offers a free tier with basic dashboarding functionality, users may need to upgrade to a paid plan to access advanced features or accommodate larger datasets. The cost of subscription plans may be a consideration for users with budget constraints or specific feature requirements.
-
Learning Curve: While Airtable's dashboard tool is designed to be user-friendly, users may still encounter a learning curve when getting started with creating and customizing dashboards. Users with limited experience in data visualization or dashboard design may find it challenging to achieve their desired outcomes.
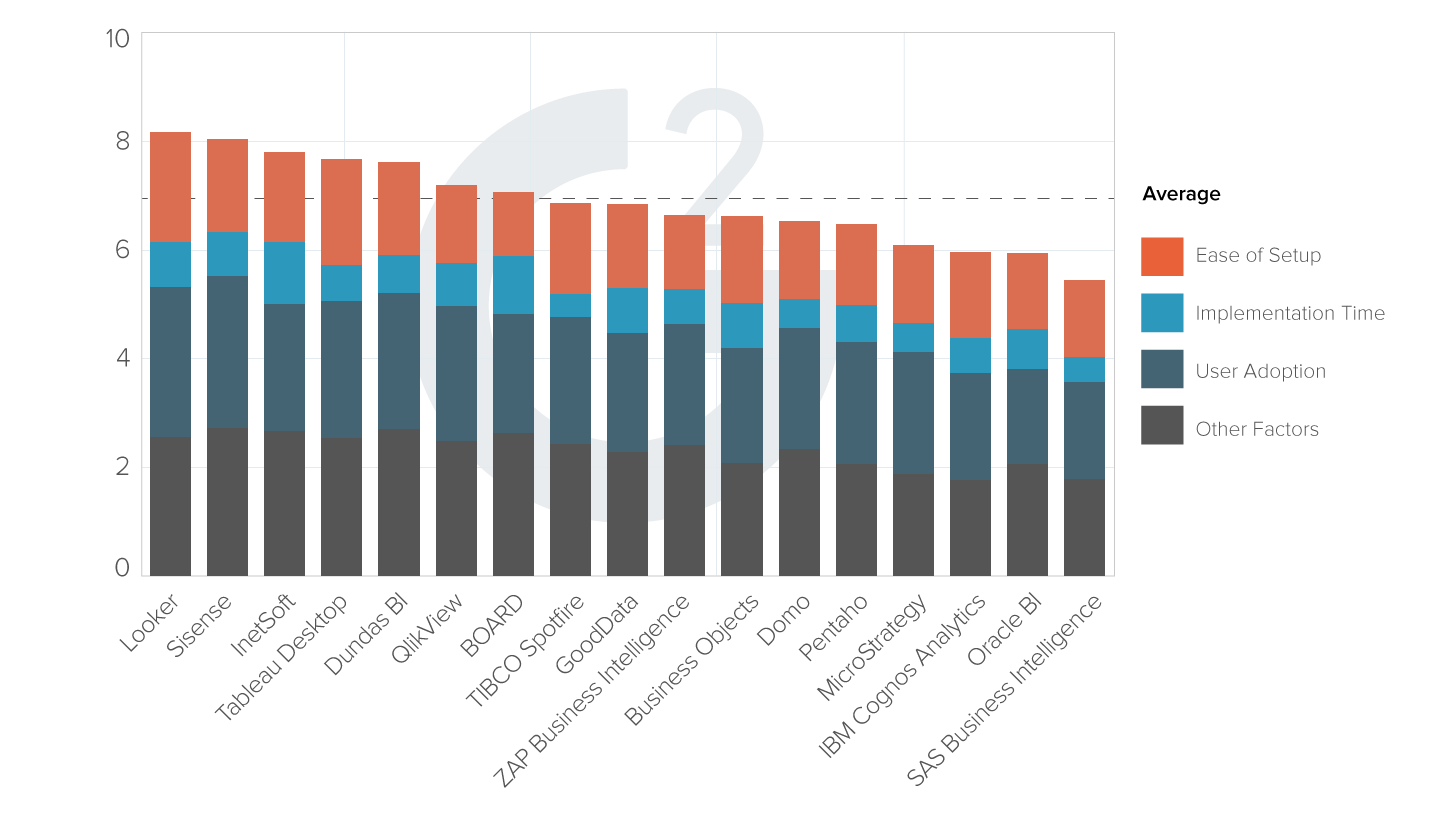
| #1 Ranking: Read how InetSoft was rated #1 for user adoption in G2's user survey-based index | Read More |
More Resources and Articles about InetSoft's Airtable Reporting Tool
2-Minute Intro Demo of Machine-Generated Intelligence - View a short 2-minute presentation to get an overview of how InetSoft's data mashup enables visual analytics, pixel-perfect reporting and machine-generated intelligence...
Amazon Reporting Application - Looking for an Amazon reporting tool? InetSoft's reporting application runs in AWS and offers maximum self-service. Highly rated for customer service and ease of deployment, InetSoft has been a pioneer in self-service BI since 1996. View a demo and try interactive examples...
Before the Fact Performance Management - Strategic planning is an important part of before the fact performance management. Things like measuring leading indicators as to what future performance might be as opposed to simply measuring lighting indicators; moving from reactive performance management in terms of focusing on red...
Demonstration of Making a Tabular Report - When I start making a tabular report, I select the Table Wizard. Now the wizard takes me through a step-by-step process and handholds me and walks me through different steps. A user with permissions can even set up batch jobs. He can schedule tasks, and say, run this report everyday at 6 o'clock in the morning and email it out to my boss. Here's where you set a time condition when you want to run this, daily, weekly, monthly, hourly and action...
Drilling Down into the Medical Dashboard - In this medical dashboard example we have opened up a table of specific and relevant data. We are looking at the mortality stats for 35-44 year old Men of Asian or Pacific Islander ethnicity. The columns have been sorted to count down from the cause of the most deaths to the least. This is the "View Details" tool...
 |
View live interactive examples in InetSoft's dashboard and visualization gallery. |
Examples of Higher Education Dashboards - Universities and higher education institutions are typically thought of as places where information and data disseminate from. However, from a business intelligence perspective, there is also a large influx of data at these types of institutions. For example, universities collect and store datasets regarding student demographics, academic performance, housing status, meal plans, academic departments, class enrollment levels, and other important information...
Information About Company Management Report Tools - Looking for good company management report tools? InetSoft's pioneering dashboard reporting application produces great-looking web-based reports with an easy-to-use drag-and-drop designer. View a demo and try interactive examples...
InetSoft's Airtable CRM Dashboard Example - Airtable is a cloud collaboration service headquartered in San Francisco. Airtable is a spreadsheet-database hybrid, with the features of a database but applied to a spreadsheet. Users can create a database, set up column types, add records, link tables to one another, collaborate, sort records and publish views to external websites...
Option for an Airtable CRM Dashboard - Looking for a cloud hosted dashboard tool to connect with your Airtable CRM? InetSoft's data mashup technology is ideal for both designers and end users who want to bring together disparate data from multiple sources, whether in the cloud or on premise. Read more here...
 |
Read the top 10 reasons for selecting InetSoft as your BI partner. |
Overview of BI Products Pricing - For the InetSoft-hosted option, the license fee is based on the type of cloud server (instance) to be used and cloud computing providers' instance pricing. The type of instance will be decided after evaluating the usage and data requirements. Options start with an Amazon AWS EC2 t3.medium instance for US$1,000 per year...
Pervasive Visual Data Exploration - InetSoft Technology, a leading provider of Operational Business Intelligence (BI) solutions, today announced the release of Style Intelligence™ 9.0 (Operational BI Suite), an unparalleled compilation of on-demand BI tools with which to explore, analyze, monitor, report and collaborate on business and operational data from multiple disparate sources, in real-time...
Reporting Software for MongoDB - Looking for a good MongoDB reporting tool? InetSoft's pioneering dashboard reporting application produces great-looking web-based reports and dashboards with an easy-to-use drag-and-drop designer. View a demo and try interactive examples...
Self-Service HR Reporting Solution - It's a pleasure to share with you a proven reporting solution that might be new to HR folks. Today's Webinar is specialized for HR professionals who need self-service HR reporting. You will see how you can create reports on your own within minutes. People say, it really cannot be that easy, but the answer is yes, it is possible by leveraging good design practices...
Read what InetSoft customers and partners have said about their selection of Style Report as their production reporting tool. |
Set Up Report Component Permissions - Report component permissions are easy to set up using InetSoft's reporting software, a highly customizable business intelligence platform built on an award winning javascript architecture. View the information below to learn more about the StyleBI solution...
SharePoint Dashboard Report Solution - InetSoft's BI software lets you build dashboard reports on SharePoint data and lets you embed dashboards using any data, including mashups, into your SharePoint server...
Software for Activity Reporting - Researching activity reporting software? Since 1996, InetSoft has been an innovator in offering easy to use, but powerful interactive, Web-based reporting software. Articles below provide more related information to help you. Also, look at the resource on the left-hand navigation menu to see examples and read reviews. A free evaluation is available...
Sophisticated Table Property Tools - InetSoft's reporting software gives you sophisticated table property tools that help you get the most from your data visualizations. View the example below to learn more about the Style Intelligence solution...
Read what InetSoft customers and partners have said about their selection of Style Scope for their solution for dashboard reporting. |
Start Using HR Reporting Software - How can you get started using HR reporting software? What are we going to help you with to give some samples to start off with. The samples that you see here are truly just that. They are samples of a variety of different reports both financial as well as HR and payroll...
Using Varying Reporting Tools - And then analysts and managers using varying reporting tools access the information in the warehouse to identify issues and trends and patterns in that information and essentially create knowledge, knowledge about how the business works...
Vendor for Embedded Analytics and Reporting - Business is an ever evolving field. As technology gets more sophisticated and the times change, businesses must adapt. They must not only adapt they way they conduct their business, however, but also the way they track it...
Web Chart Graphing Tools - Want to learn how to make a web chart? InetSoft provides easy to use state of the art web chart graphing tools. View a demo and try them out for free...
 |
Learn how InetSoft's data intelligence technology is central to delivering efficient business intelligence. |
What Is Agile Executive Dashboard Software? Looking to create an agile executive dashboard for top management? InetSoft's agile BI solution allows for the creation of visually appealing and communicative dashboards with edit functions that can be left unlocked, allowing managers to modify their dashboards in accordance with new needs that arise, and save their own personalized version...
Which is the Best Business Intelligence Reporting Tool? InetSoft offers a small-footprint, full-featured BI platform that can be deployed on commodity servers. The single Web-based application provides a streamlined, intuitive interface for all users, business executives and database analysts...
World Class Web Reporting - Our Web-based reporting software is 100% Java so it can be deployed in any computing topography providing the easiest support for large numbers of users whether they be inside or outside of the organization, wherever geographically they may be dispersed, and whatever computing platform they run...


