Environmental Testing & Compliance Firm Specializing in Construction Projects Switches from Kibana to InetSoft for Its Activity Reporting Software
Environmental testing and compliance services play a critical but often invisible role in the construction industry. From soil contamination assessments to air quality monitoring and hazardous material clearance, these firms ensure that construction projects meet regulatory requirements, protect public health, and avoid costly delays. One such company—an established environmental testing provider serving large-scale commercial and municipal construction projects—recently made a strategic shift in its analytics infrastructure. After years of relying on Kibana for activity reporting, the organization transitioned to InetSoft’s Activity Reporting Software to gain greater flexibility, governance, and operational clarity.
This article explores why the company made the switch, what challenges it faced with Kibana, and how InetSoft’s platform transformed its reporting workflows across field operations, laboratory processes, and compliance documentation.


Limitations of Kibana in a Compliance‑Driven Environment
Kibana had initially served the company well for basic log visualization and operational dashboards. However, as the firm expanded into more complex construction projects—particularly those requiring multi‑stage sampling, chain‑of‑custody tracking, and rapid turnaround times—the limitations of Kibana became increasingly apparent.
First, Kibana’s strength lies in log analytics, not structured operational reporting. Environmental testing workflows involve dozens of interconnected data points: sample IDs, field technician assignments, laboratory batch processing, instrument calibration records, regulatory thresholds, and client‑specific reporting requirements. Kibana could visualize some of this information, but it lacked the semantic modeling and governed data transformation capabilities needed to ensure consistency across reports.
Second, the company struggled with Kibana’s rigidity when building client‑facing dashboards. Construction clients often require tailored reporting views—such as soil contamination heatmaps, asbestos clearance timelines, or daily air monitoring summaries. Kibana’s templating options were limited, and customizing dashboards for different clients required significant engineering effort.
Finally, compliance documentation posed a major challenge. Environmental testing firms must maintain defensible audit trails, validated data transformations, and strict access controls. Kibana’s security model was not designed for regulated workflows where certain users must see only specific projects, sample sets, or compliance documents. The company needed a platform that could enforce row‑level security and provide a governed environment for both internal and external stakeholders.

Why InetSoft Was the Right Fit
InetSoft’s Activity Reporting Software offered a fundamentally different approach—one built around structured data modeling, flexible dashboard design, and enterprise‑grade governance. For the environmental testing firm, several capabilities stood out immediately.
1. A semantic layer tailored to operational workflows.
InetSoft allowed the company to define standardized metrics such as “sample turnaround time,” “regulatory
exceedance count,” and “field technician productivity.” These definitions were applied consistently across all
dashboards, eliminating the discrepancies that had plagued Kibana‑based reports.
2. Highly customizable dashboards for construction clients.
With InetSoft, the company could create polished, client‑specific dashboards without writing custom code.
Construction project managers could log in and instantly see contamination trends, clearance progress, or
pending sample analyses. This level of clarity strengthened client relationships and reduced the volume of
manual status updates.
3. Strong governance and security controls.
InetSoft’s row‑level security ensured that each user saw only the data relevant to their projects. Laboratory
managers could view batch processing metrics, while field supervisors saw technician schedules and sample
collection progress. External clients were restricted to their own project dashboards, satisfying regulatory
and contractual requirements.
4. Integration with existing laboratory and field systems.
The company’s Laboratory Information Management System (LIMS) and field sampling mobile app generated
structured data that InetSoft could easily ingest. Unlike Kibana, which required custom pipelines for non‑log
data, InetSoft handled these sources natively, reducing engineering overhead.
5. Better support for compliance documentation.
InetSoft’s ability to embed audit trails, data quality indicators, and transformation logic directly into
dashboards gave the company a defensible reporting framework. During regulatory audits, the firm could
demonstrate exactly how each metric was calculated and which data sources were used.

Transforming Field and Laboratory Operations
After implementing InetSoft, the environmental testing firm saw immediate improvements in operational visibility. Field supervisors gained real‑time dashboards showing technician locations, sample pickup status, and upcoming site visits. This allowed them to optimize routing, reduce idle time, and ensure that high‑priority construction projects received timely attention.
In the laboratory, managers used InetSoft dashboards to monitor instrument utilization, batch processing queues, and quality control flags. This helped them identify bottlenecks—such as overloaded instruments or delayed sample batches—and reallocate resources accordingly. The result was a measurable reduction in turnaround times, a key performance metric for construction clients who depend on rapid clearance results.
Compliance officers benefited as well. InetSoft’s governed data models ensured that regulatory thresholds, action levels, and reporting formats were applied consistently across all projects. When auditors requested documentation, the company could produce standardized, traceable reports with minimal manual effort.

Enhancing Client Communication and Transparency
One of the most significant improvements came in client communication. Construction firms often operate under tight deadlines, and delays in environmental clearance can halt entire projects. With InetSoft, clients gained access to real‑time dashboards showing sample statuses, contamination findings, and clearance progress.
This transparency reduced the number of phone calls and emails the environmental testing firm received, freeing staff to focus on fieldwork and laboratory analysis. Clients appreciated the ability to check progress at any time, and many cited the dashboards as a differentiator compared to other environmental service providers.
A Future‑Ready Reporting Platform
By switching from Kibana to InetSoft, the environmental testing and compliance company positioned itself for long‑term scalability. As construction projects grow more complex and regulatory requirements tighten, the firm now has a reporting platform capable of adapting to new workflows, integrating additional data sources, and supporting advanced analytics.
InetSoft’s combination of governed data modeling, flexible dashboard design, and compliance‑ready reporting gives the company a competitive advantage in an industry where accuracy, speed, and transparency are essential. What began as a search for better dashboards ultimately became a transformation of the firm’s entire operational reporting ecosystem.

Related Resources About Activity Reporting Software
WebLogic and Tomcat Reports - The following provides information about creating reports with WebLogic and Tomcat using InetSoft's highly adaptable reporting software. Create the WAR file you wish to be deployed. Let us assume the WAR file you wish to deploy is named c:\temp\sree\sree.war. 1. Start the default server and then the administrative console. 2. Expand the tree in the left pane and expand 'Deployments'. 3. Click on 'Web Application Modules' and in the right pane click on 'Deploy a new Web Application Module'. 4. Navigate through the directory structure to find and select the WAR file, and click on 'Target Module'. 5. Review your choices and deploy the module (clicking on 'Deploy' in the lower-right corner). 6. The new application is now deployed within WebLogic. 7. Start up a browser. You should be able to access your servlet at 'http://localhost:7001/{WAR}/{Serv}', where {WAR} is the name of the WAR file you installed and {Serv} is the name of the servlet...
Web Report Interface API - InetSoft products are shipped with an enhanced template designer, which includes functionality for creating interactive forms. Reports are viewed using the standard Letter size (8.5x11 inches) in portrait orientation. If a different size is used, this must be specified by the replet when the report is generated. Reports are viewed using the standard Letter size (8.5x11 inches) in portrait orientation. If a different size is used, this must be specified by the replet when the report is generated. A servlet instance can be accessed using the ServletRepository class when a replet intended to be run only in Web environments needs to access the servlet environment, such as the servlet context or configuration parameters. The replet API covered so far is used to create replets regardless of the presentation client. Configuration options are available to slightly modify the appearance of the Web interface. For example, header and footer messages can be added to the repository window. Launching of hyperlinks can use frame-based HTML or new browser windows. By selecting the 'Presentation' and 'DHTML' node from the navigation tree in the Enterprise Manager we can administer the DHTML presentation properties...

Web Reporting API - The InetSoft web API provides a RESTful interface for administering an InetSoft application server and accessing assets on that server. Some of the more common commands follow: Authentication is performed using the /api/public/login endpoint. The returned token must be passed to all subsequent API calls in the X-Inetsoft-Api-Token HTTP header. GET /api/public/login Used to perform single sign-on (SSO) authentication. Any headers or cookies required by the SSO implementation are the responsibility of the caller. POST /api/public/login Used to perform standard authentication with a username and password. POST /api/public/logout Used to log out of the current session. GET /api/public/dataSources/{id} Gets the full properties of a data source...
Web Reporting Engine - A characteristic of enterprise reporting is that the data sources tend to be diverse in nature. A reporting application often needs to retrieve data from multiple data sources, each with a different protocol. Instead of forcing a relational view on all data sources, the Style Report reporting engine allows report developers to connect to any data source through a Java API, and the most common data sources using the visual query builder...
Web Reporting Software - InetSoft's Style Report is a Java reporting software application that has earned the Java Developers Journal Readers Choice Award for best Java Reporting Tool 8 years consecutively. Style Report software enables enhanced query, reporting, and analysis capabilities with real-time access to data regardless of source, format or platform...
Web based Ad Hoc Reporting - Information about InetSoft's 100% Java, Web-based ad hoc reporting server application Style Report Enterprise. The user interface is 100% Flash, requiring just a Flash plug-in for any browser...
Web Report - How do you get the newest, most accurate intelligence about your organization's performance into the hands that need it the most? Through reports accessible over the web. Communicating data efficiently and effectively is paramount to realizing your business plan...

Web Reports Builder - InetSoft's award-winning software, StyleBI includes a high-performance Web reporting engine that enables sophisticated and flexible reporting. Users can build their own reports and personalize them through parameterization or other security features. Data sources tend to be diverse in nature. A reporting application will often need to retrieve data from multiple data sources, each with a different protocol. Instead of forcing a relational view on all data sources, the StyleBI engine allows report developers to connect to any data source through a Java API. The most common data sources using the visual query builder. Style Report's professional authoring tool combines word-processing grade design with dynamic data manipulation...
Weekly Leadership Report Tool - Searching for a leadership weekly report tool? Easily build formatted or interactive leadership weekly reports with InetSoft's advanced flexible BI tool. Highly rated for customer service and ease of deployment, InetSoft has been a pioneer in self-service BI since 1996. View a demo and try interactive examples...
Weekly Reporting Tools - Weekly reports are vital for the regular monitoring and control of business conditions. But in many cases, the production of weekly reports puts additional demands on administrators and employees. And with so much business travel and work done out in the field, report accessibly and deliverability can also be an issue. Our solution, StyleBI, makes the setting up and delivery of weekly reports easy and efficient...
Weekly Staff Reporting Tool - Looking for a good weekly staff reporting tool? InetSoft's pioneering dashboard reporting application makes producing great-looking web-based reports and dashboards easy with a drag-and-drop designer and the ability to connect to all your data sources. View a demo and try interactive examples...
What Are the Advantages of Thin Client Reporting? - Thin client reporting refers to a reporting system where the processing and rendering of reports occur on the server side, and users access and view reports through a lightweight client, typically a web browser. This approach offers several advantages: Centralized Management: Ease of Updates and Maintenance: Thin client reporting centralizes report management on the server, allowing for easier updates and maintenance. Changes and updates can be applied centrally without requiring individual client installations. Accessibility and Cross-Platform Compatibility: Anytime, Anywhere Access: Thin client reporting enables users to access reports from any device with a web browser, providing flexibility and convenience. This accessibility is particularly advantageous for organizations with geographically dispersed teams or remote work setups. Reduced Client-Side Resources: Lower System Requirements: Thin clients have minimal software requirements, reducing the burden on client-side resources. This can be beneficial for users with lower-end devices or in environments where resource-intensive applications are not practical. Improved Security: Data Security: Thin client reporting can enhance data security by keeping sensitive data and report logic on the server. This minimizes the risk of data exposure or unauthorized access from the client side...
What Are the Customer Reporting Metrics That a Fast Food Franchisee Tracks? - Operating a fast-food franchise involves monitoring various metrics to ensure operational efficiency, customer satisfaction, and profitability. Here's a comprehensive list of reporting metrics that fast-food franchisees typically track: Sales Performance Metrics: Total Sales Revenue: The overall revenue generated from food and beverage sales. Sales by Product Category: Sales performance broken down by categories such as burgers, fries, beverages, desserts, etc. Average Transaction Value: The average amount spent per customer transaction. Sales by Daypart: Sales performance during different times of the day (e.g., breakfast, lunch, dinner, late-night). Sales by Location: Sales performance comparison among different franchise locations, if applicable. Customer Metrics: Customer Count: The total number of customers served within a specific period. Customer Satisfaction Scores: Feedback scores from customer surveys or online review platforms...
What Are the Drawbacks of JasperReports? - JasperReports is a widely used open-source reporting library that allows developers to add reporting capabilities to their applications. While JasperReports offers various advantages, it's important to consider potential drawbacks as well. Here are some drawbacks associated with JasperReports: Learning Curve: JasperReports has a steep learning curve, especially for beginners. Creating complex reports may require a good understanding of the JasperReports library, its XML-based report templates, and the associated concepts. This might pose a challenge for developers who are new to the tool. Complexity of Report Templates: Creating and maintaining report templates in JasperReports involves dealing with XML files, which can be intricate and challenging to manage. Modifying or customizing complex reports may require a deep understanding of the underlying XML structure, making it less user-friendly for some developers. Limited WYSIWYG Editor: While JasperReports does provide a visual report designer (Jaspersoft Studio), the WYSIWYG (What You See Is What You Get) editor may not be as intuitive or feature-rich as some commercial alternatives. This could impact the ease of designing reports for users who prefer a more visual approach...
What Are the Drawbacks of Microsoft's Report Builder? - Microsoft's Report Builder, like any software tool, has its drawbacks, despite being a widely used and respected reporting solution. Here are some common drawbacks associated with Report Builder: Complexity for Beginners: While Report Builder aims to provide a user-friendly interface, beginners may find it overwhelming due to the plethora of options and functionalities available. Creating complex reports may require a steep learning curve, especially for users who are not familiar with SQL queries or data modeling concepts. Limited Visualizations: While Report Builder offers a decent range of chart types and visualization options, it may not be as extensive or visually appealing as some other reporting tools. Users seeking highly interactive or customizable visualizations may find the options in Report Builder somewhat limited...
What Are the Reasons to Use a REST API as a Data Source for Reporting? - Using a REST API as a data source for reporting offers several advantages, making it a popular choice for integrating data into reporting solutions. Here are some of the key reasons to use a REST API for reporting: Real-Time Data Access: REST APIs allow for real-time access to data, enabling reporting systems to retrieve the latest information directly from the source systems. This ensures that reports are always based on up-to-date data, providing users with accurate insights and actionable information. Flexible Data Retrieval: REST APIs provide flexibility in how data is retrieved and filtered. Reporting systems can specify parameters in API requests to retrieve only the relevant data needed for generating reports, reducing the processing overhead and improving performance. Standardized Communication: REST APIs use standardized communication protocols such as HTTP and JSON, making it easy to integrate with a wide range of reporting tools and platforms. This interoperability ensures compatibility and simplifies the integration process for developers...
What Are the Reporting KPIs for a Department of Business Licensing and Permits? - Managing a Department of Business Licensing and Permits involves overseeing the issuance, renewal, and compliance of various licenses and permits required for businesses to operate legally. To effectively measure the performance and efficiency of such a department, it's important to track a range of key performance indicators (KPIs). Here are some important KPIs you might consider: Application Processing Time: This KPI measures the average time taken to process license and permit applications from submission to approval. Tracking this metric helps assess the efficiency of the department in handling requests and providing timely responses to businesses. Application Approval Rate: Monitoring the percentage of applications approved versus total applications received provides insights into the department's effectiveness in evaluating and approving applications. A high approval rate indicates efficient processing and clear communication of requirements. Customer Satisfaction: Surveys or feedback mechanisms can gauge satisfaction levels among business owners and applicants regarding the licensing and permitting process. Positive feedback indicates effective service delivery and customer support...
What Are the Reporting KPIs for a Director of Recycling Programs? - As a Director of Recycling Programs, your role involves overseeing various aspects of recycling initiatives within an organization or community. To effectively measure the performance and impact of these programs, you'll need to track a range of key performance indicators (KPIs). Here are some important KPIs you might consider: Recycling Rate: This is perhaps the most fundamental KPI for assessing the success of recycling programs. It measures the percentage of total waste that is diverted from landfills through recycling efforts. Increasing this rate over time demonstrates the effectiveness of your programs in promoting recycling behaviors. Waste Diversion: Similar to recycling rate, waste diversion measures the percentage of waste that is diverted from landfill disposal through recycling, composting, or other sustainable disposal methods. It provides a broader view of your programs' impact beyond just recycling...
What Are Some Drawbacks to insightsoftware's Reporting Solution? - insightsoftware offers a robust reporting solution that provides organizations with powerful tools to analyze and visualize their data effectively. However, like any software solution, there may be some drawbacks or limitations that users should consider. Here are some potential drawbacks to insightsoftware's reporting solution: Complexity of Implementation: Depending on the complexity of an organization's data infrastructure and reporting requirements, implementing insightsoftware's reporting solution may require significant time and resources. Integrating with various data sources, configuring reports, and training users can add complexity to the implementation process. Learning Curve: While insightsoftware's reporting solution aims to provide intuitive tools for creating and customizing reports, there may still be a learning curve for users who are unfamiliar with the platform. Training and support may be necessary to help users maximize the functionality of the software...
What Are the Reporting Metrics That Are Tracked for Civic Engagement? - Civic engagement encompasses a wide range of activities and initiatives aimed at promoting participation, collaboration, and involvement in community and civic affairs. Reporting metrics for civic engagement focus on measuring the extent and impact of citizen participation, community involvement, and public interaction with government and civic organizations. Here are some key reporting metrics commonly tracked for civic engagement: Voter Turnout: The percentage of eligible voters who participate in elections, including local, state, and national elections. Voter turnout metrics help assess the level of citizen engagement in the democratic process and the effectiveness of voter outreach efforts. Public Meeting Attendance: The number of individuals attending public meetings, town halls, community forums, and other civic gatherings. Tracking meeting attendance provides insights into community interest and involvement in local decision-making processes. Online Engagement Metrics: Website Traffic: The number of visitors to government websites, community forums, and online platforms for civic engagement. Social Media Engagement: Metrics such as likes, shares, comments, and followers on social media platforms used for public outreach and engagement...
What Are Some Reasons to Consider InetSoft's Reporting Services? - several features and advantages that make it a compelling choice for organizations seeking robust reporting and business intelligence solutions. Here are some reasons to consider InetSoft's Reporting Services: Data Connectivity and Integration: InetSoft supports a wide range of data sources, including databases, spreadsheets, cloud services, and web services. This versatility enables organizations to easily connect and integrate data from various sources into their reports, providing a comprehensive view of their business operations. Advanced Data Visualization: InetSoft provides a variety of visualization options, including charts, graphs, heat maps, and more. This enables users to present data in a visually appealing and interactive manner, making it easier to identify trends, patterns, and insights. Interactive Dashboards: InetSoft's reporting services allow users to create interactive dashboards with drill-down capabilities. This empowers stakeholders to explore data at different levels of detail and gain deeper insights into their business metrics. Self-Service Reporting: InetSoft offers intuitive drag-and-drop report design capabilities, making it accessible to a wide range of users, including those without extensive technical knowledge. This promotes self-service reporting, allowing users to generate their own reports and reduce dependence on IT teams...

What Are Some Reasons to Replace Microsoft Reporting Services? - Replacing Microsoft Reporting Services (SSRS) can be a significant decision for an organization, and there are several compelling reasons that might prompt such a move. Here are some considerations: Limited Data Visualization Capabilities: SSRS primarily focuses on tabular reports and lacks the advanced data visualization capabilities that are increasingly important for modern business intelligence needs. If an organization requires more interactive and visually appealing reports, exploring alternative solutions might be necessary. Complexity and Learning Curve: SSRS can be complex for users who are not familiar with it. Building and customizing reports often requires knowledge of SQL and SSRS-specific scripting. Switching to a more user-friendly reporting tool with a lower learning curve can improve efficiency and productivity. Integration with Modern Data Ecosystems: As organizations adopt cloud-based solutions and modern data platforms, compatibility with these environments becomes crucial. SSRS may face challenges when integrating with cloud-based data storage and processing systems like AWS, Azure, or Google Cloud...
What Are Some Reports That a Home Builder Would Have Automatically Emailed to Managers? - Home builders rely on a variety of reports to effectively manage their projects, resources, finances, and customer relationships. Automating the emailing of reports to managers ensures timely access to critical information, enabling informed decision-making and proactive management. Here are some reports that a home builder might automatically email to managers: Project Status Reports: These reports provide an overview of the status of ongoing construction projects, including milestones achieved, tasks completed, and upcoming deadlines. They may also include information on project timelines, budget vs. actual expenditures, and any issues or risks that need attention. Sales and Marketing Reports: Sales and marketing reports track key performance indicators related to leads, conversions, sales volumes, and marketing campaign effectiveness. They provide insights into sales trends, customer preferences, and market demand, helping managers assess the success of sales and marketing strategies and make data-driven decisions. Financial Reports: Financial reports, such as profit and loss statements, cash flow statements, and balance sheets, offer a comprehensive view of the company's financial health. Automating the emailing of financial reports to managers allows them to monitor revenue, expenses, profitability, and cash flow on...
What Are the Steps to Automate Marketing Reports? - Here's a step-by-step guide to help you begin automating your marketing reports: Define Your Reporting Objectives: Determine the key performance indicators (KPIs) and metrics that are crucial for your marketing efforts. Identify what data you want to include in your reports and the frequency of reporting (e.g., weekly, monthly, quarterly). Choose the Right Tools: There are various marketing automation and reporting tools available in the market. Select a tool that aligns with your reporting needs and integrates well with your existing marketing platforms (e.g., Google Analytics, social media platforms, email marketing tools). Data Collection and Integration: Ensure that all the relevant data sources are integrated into your reporting tool. This may require setting up API connections or data exports from your marketing platforms to the reporting tool...
What Are the Uses of Paginated Reports? - Paginated reports are designed to display data in a printed or fixed format. They are typically used in situations where there is a need for high-quality, paginated reports that can be printed, emailed or exported to different formats such as PDF, Excel, or CSV. Here are some common uses of paginated reports: Financial and accounting reports: Paginated reports are commonly used for financial and accounting reports such as balance sheets, income statements, and cash flow statements. These reports require a fixed layout to ensure accuracy and compliance with accounting standards. Operational reports: Paginated reports are also used for operational reports such as daily, weekly, or monthly sales reports, inventory reports, and production reports. These reports provide a summary of the operational performance of a business or organization...
What Are the Ways Writing a BI Report Can Be Intuitive? - Writing a Business Intelligence (BI) report that is intuitive involves presenting complex data and insights in a clear, understandable manner. There are several ways in which writing a BI report can be intuitive, ultimately enhancing its effectiveness and usability. Firstly, organizing the report in a logical structure helps readers navigate through the information effortlessly. This involves starting with an executive summary or introduction that provides an overview of the key findings and conclusions. Subsequent sections should be arranged in a cohesive manner, with each section focusing on a specific aspect of the data analysis. Clear headings, subheadings, and bullet points can further aid in guiding the reader through the report, ensuring that they can easily locate the information they are interested in. Secondly, using visualizations such as charts, graphs, and tables can make complex data more digestible and intuitive to comprehend. Visual representations help to convey...
What Big Data Reporting Tools Are There? - If we have all this data, and we need to do analytics on it. What reporting tools can we use to get the stuff back out? Can we use SSRS which is SQL Server Reporting Services? The short answer to that one is yes. The key to all of these, and I want to put a big asterisks on this, because these is the approach we’re going to use today. I really think it’s kind of a stop gap measure, and it’s going to change, but I mention thing called Hive that in effect creates a SQL abstraction layer over Hadoop. And what Microsoft has done is to create an ODBC driver for Hive, so in effect any ODBC client can talk to Hadoop via this ODBC driver, and the Hive layer over Hadoop, that includes reporting services. That includes knowledge integration services. It includes only the new tabular mode of analysis services. The original multidimensional mode of analysis services actually wouldn’t really work with ODBC. It’ll only it only work with only the Big Data sources. I didn’t even know that until I tried to get it to work against Hadoop, and I discovered that. And powerview, which is Microsoft’s new analysis and data visualization product, that is part of SQL Server, and it runs inside of Share Point...
What Charts and KPIs to Use in a Content Marketing Reporting Dashboard? - Using a content marketing reporting dashboard is a great way to keep track of your company's marketing efforts. This visual tool aggregates and shows a range of metrics and key performance indicators (KPIs) to help you gauge the effectiveness of your marketing strategies. In short, a content marketing reporting dashboard provides a centralized view of how well your content is performing in terms of driving engagement, traffic, and leads. However, the software you choose will greatly impact how efficient a reporting dashboard is. To make a good choice, you need to research and try platforms where you can find and compare the best 10 SEO software solutions for your digital marketing needs. But even when you have picked one, it's important to customize it using the right charts and the most useful KPIs for your business. Let's find out more about it now...
What Do Laboratory Analysts Put in Database Reports? - Laboratory analysts play a crucial role in generating and managing data for scientific research and experiments. The contents of a database report created by a laboratory analyst typically include: Experiment Details: Title of the experiment. Date(s) when the experiment was conducted. Name(s) of the experimenters or analysts involved. Objective and Hypothesis: The specific goal or purpose of the experiment. Any hypotheses or expectations that were tested. Experimental Design: Description of the experimental setup, including equipment used, reagents, and materials. Details about control groups, replicates, and any randomization procedures...
What Do Pharmaceutical Research Managers Put in Database Reports? - Pharmaceutical research managers oversee the development and execution of research projects within the pharmaceutical industry. They are responsible for ensuring that database reports contain comprehensive and relevant information. Here's what pharmaceutical research managers typically include in database reports: Project Overview: Title and code of the project. Names of the researchers, analysts, and team members involved. Brief description of the project's goals and objectives. Timeline and Milestones: Start and end dates of the project. Milestones achieved at various stages of the research. Budget and Resource Allocation: Details of the budget allocated for the project. Breakdown of expenses, including personnel, equipment, supplies, and external services. Regulatory Compliance and Ethical Considerations: Documentation of compliance with regulatory agencies' guidelines and requirements. Ethical considerations and approvals obtained from relevant review boards...
What Does the Director of a Social Welfare Program Track Using a Reporting Tool? - The Director of a Social Welfare Program typically tracks a wide range of metrics and data points using a reporting tool to ensure the effective delivery of services, monitor program performance, and make informed decisions. Here are several key areas that the Director may focus on: Client Demographics and Caseload Management: Tracking demographic information such as age, gender, ethnicity, and socioeconomic status of program participants. Monitoring caseload size and caseload distribution among staff to ensure workload balance and efficient service delivery. Service Utilization and Outcome Measures: Recording the types and frequency of services provided to clients, such as counseling, financial assistance, housing support, healthcare, etc. Tracking outcome measures such as improvements in clients' well-being, increased self-sufficiency, employment status, housing stability, and overall satisfaction with services received. Program Efficiency and Effectiveness: Monitoring wait times for services, appointment scheduling, and service delivery times to ensure timely access to assistance. Assessing program efficiency by tracking the ratio of staff-to-client caseloads, average duration of client engagement, and resource utilization...
What Does Management at an Aerospace Company Want to See on Their Weekly Report? - Management at an aerospace company typically wants to see a comprehensive overview of key performance indicators (KPIs) and critical updates that reflect the company's operational, financial, and strategic status. A weekly report serves as a valuable tool for keeping stakeholders informed and aligned with the company's goals and objectives. Here's a breakdown of what management at an aerospace company might want to see in their weekly report: Financial Performance: Revenue and Sales: Breakdown of revenue generated during the week, including any significant changes compared to previous weeks. Cost Analysis: Overview of major expenses, such as production costs, R&D, and overheads. Profit Margins: Gross and net profit margins to evaluate profitability. Production and Operations: Production Volume: Number of units produced, including aircraft, components, or systems. Yield and Quality Metrics: Information on production yield, defect rates, and quality control results. Capacity Utilization: How effectively production capacity is being used. Supply Chain and Procurement: Supplier Performance: Evaluation of key suppliers in terms of on-time deliveries, quality of components, and cost-effectiveness. Inventory Levels: Status of raw materials, work-in-progress, and finished goods inventory...

What Does a Product Manager at a Semiconductor Fabrication Company Put in a Report? - A Product Manager at a semiconductor fabrication company plays a critical role in overseeing the development, production, and marketing of semiconductor products. Custom reports are essential tools for them to gather, analyze, and present data for decision-making and strategy development. Here's a detailed breakdown of what a Product Manager might include in a custom report: Executive Summary: Objective: Clearly state the purpose of the report. Is it to assess product performance, market trends, or production efficiency? Key Takeaways: Summarize the most important findings and recommendations in a concise manner. Market Analysis: Market Trends: Provide an overview of current trends in the semiconductor industry. This could include emerging technologies, demand shifts, and competitive l andscape changes. Competitor Analysis: Evaluate the performance of key competitors. This might encompass market share, product offerings, pricing strategies, and customer feedback...
What Does a Vice President of Content Development and Production in the Entertainment Industry Need to See in a Weekly Report? - Project Status Updates: Detailed information on the status of each project in development or production. This includes any significant milestones achieved, challenges faced, and progress made towards completion. Budgetary Information: A breakdown of the budget for each project, including expenditures to date, remaining budget, and any potential overages or cost-saving measures implemented. Timeline and Schedule: A timeline showing the project's progress compared to the initial schedule. This should highlight any delays, adjustments to the timeline, and upcoming milestones. Resource Allocation: Information on the allocation of resources such as crew members, equipment, and studio space. This includes any adjustments made to accommodate changes in project scope or schedule...
What Goes Into a Software Testing and QA Report? - As more and more companies move to digital solutions, among the most important elements for a successful product launch are software testing and quality assurance (QA). Quality control processes create the foundation necessary for building reliable applications. While many elements go into quality assurance, from developing test plans, executing tests, and debugging issues to root cause analysis, each piece helps build confidence in the product when deployed to your customers. But how do you track that progress throughout each step of development? The answer lies in creating and utilizing an effective QA report. The testing phase of a project ensures that a product is high-quality and meets all the requirements. This phase includes manual testing, which is done by a human, or automated testing, where software tools are used to execute tests. Other forms include performance testing, where the system is assessed under various stress levels to determine its capacity limits...
What Is the Purpose of a Patient Care Report? - Patient care is one of the main objectives of every hospital or healthcare institution. Many functions and processes are involved in patient care. It is important to routinely check and maintain these functions to serve the patients better. Hospitals can also become more efficient and reduce a lot of errors. In order to properly enhance and manage their services, medical facilities of any kind are required to maintain and document patient care in great detail. The information gathered from the customers and the employees about how satisfied they are with the service might provide useful insight. So, to fully understand the purpose of the patient care report, let us understand the benefits of this report and improve each process in healthcare...

What Is SQL Reporting Services Used For? - Relational databases are often managed and worked on using the computer language known as Structured Query Language (SQL). Developers may build and distribute reports that assist users in the analysis and interpretation of data using the toolset known as SQL Reporting Services (SSRS), which is built on top of SQL Server. The definition and applications of SQL Reporting Services will be covered in this article. What Is SQL Reporting Services (SSRS)? Users may develop, maintain, and distribute a wide range of reports using SQL Reporting Services (SSRS), a server-based reporting platform. It is a part of Microsoft's SQL Server toolkit and may be used to create reports from a variety of data sources, such as SQL Server, Oracle, and ODBC-compliant databases. Tables, charts, graphs, and maps are just a few of the many report formatting capabilities offered by SSRS. Reports may also have photos, logos, and other branding components added to them...
What Kind of Analytic Reports Do Election Boards Generate? - Election boards generate a variety of analytic reports to monitor and evaluate various aspects of the electoral process, ensure transparency, and uphold the integrity of elections. These reports provide valuable insights into voter registration, turnout, candidate performance, election administration, and compliance with legal and regulatory requirements. Here are some common types of analytic reports generated by election boards: Voter Registration Reports: These reports analyze voter registration data to track the number of registered voters, voter demographics (e.g., age, gender, ethnicity), registration trends over time, and geographic distribution of registered voters within electoral districts. Voter Turnout Reports: Voter turnout reports assess voter participation in elections by analyzing turnout rates, absentee and early voting statistics, polling place turnout, and comparisons with historical turnout data. These reports help election officials gauge the effectiveness of voter outreach efforts and identify barriers to voter participation...
What Kinds of Users Can Create Reports with the Wizard Tool? - The goal of report wizard tools is to democratize the reporting process, making it accessible to a broader range of users. These tools often abstract technical complexities, enabling users with varying levels of technical expertise to harness the power of data and generate meaningful reports for decision-making purposes. Non-Technical Users: A report wizard is often designed to be user-friendly and intuitive, allowing individuals without extensive technical or programming skills to generate reports. This empowers business users to create reports tailored to their specific needs. Business Analysts: Professionals with a deeper understanding of business processes and data analysis may use report wizard tools to quickly generate reports without relying on IT or technical support. This enhances their agility in extracting insights from data. Managers and Executives: Decision-makers at various levels within an organization may use report wizards to create ad-hoc reports for quick decision-making. This allows them to have timely access to relevant information without depending on dedicated reporting teams...
What KPIs and Metrics Do Directors of Senior Services Track with Ad Hoc Reporting Tools? - Directors of senior services utilize ad hoc reporting tools to track various key performance indicators (KPIs) and metrics to ensure the effective delivery of services and the overall well-being of senior citizens under their care. These metrics help directors assess the quality of care, operational efficiency, financial performance, and client satisfaction. Here are some common KPIs and metrics tracked by directors of senior services: Occupancy Rate: The occupancy rate measures the percentage of available beds or units that are filled by residents. It helps directors assess the demand for their services and optimize resource allocation. Average Length of Stay: This metric calculates the average duration that residents stay in the senior living facility or receive services. Understanding the length of stay helps directors forecast capacity needs, plan staffing levels, and assess client satisfaction...
What KPIs and Metrics Do Election Officials Visualize with Reporting Software? - Election officials utilize reporting software to track various key performance indicators (KPIs) and metrics to ensure smooth operations, monitor voter engagement, and maintain the integrity of the electoral process. Here are some essential KPIs and metrics commonly visualized with reporting software in election management: Voter Turnout: One of the most critical metrics, voter turnout, indicates the percentage of eligible voters who participated in the election. This metric helps election officials assess the effectiveness of voter outreach efforts and the overall level of civic engagement in the community. Registration Rates: Tracking voter registration rates provides insights into the number of eligible voters who have registered to vote. This metric helps election officials identify any barriers to registration and tailor outreach efforts to increase voter registration. Voting Wait Times: Monitoring voting wait times at polling locations helps election officials identify areas with high voter traffic and allocate resources accordingly. By reducing wait times, officials can improve the voting experience and encourage greater participation...
What KPIs and Metrics Do Natural Gas Producers Track with Reporting and Inquiry Tools? - Natural gas producers utilize reporting tools to track various key performance indicators (KPIs) and metrics to assess the efficiency, productivity, and profitability of their operations. Here are some of the common KPIs and metrics tracked by natural gas producers: Production Volume: This metric indicates the amount of natural gas produced over a specific period, usually measured in cubic feet (or cubic meters) per day or per month. It helps producers understand their output levels and identify any trends or fluctuations. Production Efficiency: Production efficiency measures how effectively natural gas is extracted and processed from wells. It considers factors such as downtime, equipment reliability, and operational efficiency to ensure optimal production levels. Well Productivity: Well productivity metrics evaluate the performance of individual wells, including production rates, decline curves, and depletion rates. Analyzing well productivity helps producers identify high-performing assets and optimize reservoir management strategies...
What KPIs and Metrics Does the Municipal Department of Building Permits and Inspections Use in Its Customizable Reporting Software? - The Municipal Department of Building Permits and Inspections typically employs various key performance indicators (KPIs) and metrics to evaluate the efficiency, effectiveness, and compliance of its permitting and inspection processes. These metrics help assess the department's performance in managing construction activities, ensuring regulatory compliance, promoting public safety, and supporting economic development. Here are some common KPIs and metrics used by such departments: Permit Processing Time: Average Permit Turnaround Time: The average time taken to review and approve building permit applications, from submission to issuance. Time to First Review: The time elapsed between receiving an application and conducting the initial review. Time to Final Approval: The duration required to complete the entire permit approval process, including any revisions or additional documentation. Permit Issuance and Renewal Rates: Permit Issuance Rate: Percentage of permit applications approved and issued compared to the total number of applications received. Renewal Compliance: Percentage of permit holders who renew their permits on time and comply with renewal requirements...
What KPIs and Metrics Does the Wastewater Management Department Display in Presentation and Reporting Software? - The wastewater management department typically uses a variety of key performance indicators (KPIs) and metrics to monitor and improve the efficiency, effectiveness, and sustainability of their operations. These KPIs and metrics help assess various aspects of wastewater treatment and management processes. Here are some common examples: Effluent Quality Parameters: Chemical Oxygen Demand (COD): Measures the amount of oxygen required to oxidize organic compounds in wastewater, indicating the level of organic pollution. Biological Oxygen Demand (BOD): Indicates the amount of dissolved oxygen needed by aerobic organisms to break down organic material in wastewater, providing insight into the organic pollution level and the health of the aquatic environment. Total Suspended Solids (TSS): Measures the concentration of solid particles suspended in wastewater, which can affect water clarity, aquatic life, and treatment processes...
What KPIs Should a Report Development Team Use? - For a report development team, the KPIs they use can have a significant impact on the quality and effectiveness of the reports they produce. This essay will discuss the KPIs that are most relevant for a report development team, and how they can help to ensure the team is meeting its objectives. Report delivery time: One of the most important KPIs for a report development team is the time it takes to deliver a report from the time it was requested. This KPI is a measure of the team's efficiency and effectiveness in delivering reports in a timely manner. It can be used to identify bottlenecks in the report development process and to ensure that the team is meeting its deadlines. Report accuracy: Another important KPI is the accuracy of the reports produced by the team. This KPI can be measured by comparing the data in the report to the source data, and by tracking the number of errors and inaccuracies that are found in the reports. The report accuracy KPI can be used to identify areas where the team needs to improve its processes or data sources, and to ensure that the reports produced by the team are reliable and trustworthy. User satisfaction: The satisfaction of the users of the reports produced by the team is another critical KPI. This KPI can be measured through surveys or feedback mechanisms that allow users to rate the quality and usefulness of the reports. User satisfaction can provide valuable insights into the effectiveness of the reports, and can help the team to identify areas for improvement...
What Makes InetSoft a Good Option for Creating Reports for Data in SQL Server? - InetSoft is recognized as a robust business intelligence and reporting solution that offers various features making it a good option for creating reports for data in SQL Server. Here are some key aspects that contribute to InetSoft's appeal in this context: Intuitive Drag-and-Drop Interface: InetSoft provides an intuitive drag-and-drop interface for report creation. This makes it easy for users, even those without extensive technical expertise, to design and customize reports using data from SQL Server databases. Connectivity to Multiple Data Sources: InetSoft supports connectivity to various data sources, including SQL Server databases. This flexibility allows users to seamlessly integrate and retrieve data from their SQL Server environments for report generation. Advanced Data Visualization Options: The platform offers a range of advanced data visualization options, including charts, graphs, and dashboards. Users can represent SQL Server data in a visually compelling manner, making it easier to analyze and understand complex datasets. Ad Hoc Reporting Capabilities: InetSoft empowers users with ad hoc reporting capabilities. This means users can create reports on the fly, explore data interactively, and generate insights without relying on predefined reports. This flexibility is crucial for dynamic business environments...
What Report Metrics Are Tracked for Community Development Initiatives? - Community development initiatives aim to improve the quality of life, economic opportunities, and social well-being of residents within a community. Tracking and measuring the impact of these initiatives is crucial for assessing effectiveness, allocating resources, and guiding future efforts. Here are some common report metrics that are tracked for community development initiatives: Economic Development Metrics: Job Creation: Tracking the number of new jobs created through economic development projects, business expansions, and workforce development programs. Business Growth: Monitoring the number of new businesses established, business retention rates, and growth in sales revenue. Investment Attraction: Tracking private and public investments attracted to the community, including capital investment, grants, loans, and tax incentives. Housing and Neighborhood Development Metrics: Affordable Housing Units: Monitoring the production and preservation of affordable housing units to address housing affordability challenges. Homeownership Rates: Tracking changes in homeownership rates and homeownership assistance programs to promote homeownership opportunities. Neighborhood Revitalization: Assessing the impact of neighborhood revitalization efforts on property values, crime rates, infrastructure improvements, and community pride...
What Reports Are Included in Treasury Software? - Treasury software is designed to streamline and automate financial operations related to cash management, liquidity management, risk management, and financial reporting within an organization's treasury or finance department. The software typically includes a variety of reports to provide insights into cash flows, investment portfolios, debt management, and compliance with regulatory requirements. Here are some common types of reports that would be included in treasury software: Cash Position Reports: Daily Cash Position: Provides a snapshot of the organization's cash balances across various accounts and entities, including bank accounts, investment accounts, and cash equivalents. Cash Forecasting: Predicts future cash flows based on historical data, budget projections, and forecasted transactions, helping treasury professionals optimize liquidity management and funding strategies. Bank Account Management Reports: Bank Account Summary: Lists all bank accounts maintained by the organization, along with account details, balances, transaction histories, and signatories...
What Reports and Charts Are Available in a Financial Markets Client Portal? - Here are some common types of reports and charts available in a financial markets client portal: Account Overview Reports: Portfolio Summary: Provides a high-level overview of the client's investment portfolio, including total market value, asset allocation, and performance metrics. Account Holdings: Details the securities held in the client's account, including stocks, bonds, mutual funds, ETFs (Exchange-Traded Funds), and other investment products, along with quantities, prices, and market values. Performance Reports: Portfolio Performance: Displays the historical performance of the client's investment portfolio over time, including returns, benchmark comparisons, and attribution analysis. Time-Weighted Returns (TWR): Calculates the investment returns adjusted for the timing and size of cash flows, providing an accurate measure of portfolio performance independent of external cash flows. Transaction History Reports...
What Reports Would Be Included in Practice Analytics Software? - Practice analytics software is designed to provide insights and data-driven decision-making support for various aspects of managing a medical or healthcare practice. The reports included in such software typically cover a wide range of operational, financial, and clinical metrics aimed at optimizing practice performance, improving patient care, and ensuring regulatory compliance. Here are some common types of reports that would be included in practice analytics software: Financial Reports: Revenue Analysis: Breakdown of revenue sources, including payments, reimbursements, and collections, by payer, service type, provider, or location. Accounts Receivable (AR) Aging: Analysis of outstanding balances owed to the practice, categorized by aging buckets (e.g., 30 days, 60 days, 90 days+). Profit and Loss (P&L) Statements: Summary of practice financial performance, detailing revenues, expenses, and net income over a specific period. Budget vs. Actuals: Comparison of budgeted financial targets with actual performance to identify variances and areas for improvement. Operational Reports: Appointment Scheduling and Utilization: Analysis of appointment volumes, scheduling efficiency, provider utilization rates, and appointment wait times...
What Reporting KPIs Does a Chemical Process Operator Track? - Chemical process operators play a crucial role in ensuring the efficient and safe operation of chemical manufacturing processes. To effectively monitor and control these processes, operators track various key performance indicators (KPIs) related to production, quality, safety, and environmental compliance. Here are some common reporting KPIs that chemical process operators typically track: Production Rate: The production rate measures the quantity of product manufactured per unit of time (e.g., kilograms per hour or barrels per day). Monitoring production rates helps operators ensure that production targets are being met and identify any deviations that may indicate equipment malfunctions or process inefficiencies. Yield: Yield refers to the percentage of raw materials that are converted into usable products during the manufacturing process. Tracking yield helps operators assess the efficiency of the production process and identify opportunities for optimization or waste reduction. Quality Metrics: Quality metrics include parameters such as product purity, composition, viscosity, pH, color, and other physical or chemical properties. Operators monitor these metrics to ensure that the final product meets the required specifications and quality standards...
What Reporting KPIs and Metrics Does a Building Maintenance Department Use? - Building maintenance departments use a variety of key performance indicators (KPIs) and metrics to assess the effectiveness, efficiency, and quality of their maintenance operations. These metrics help measure performance, track progress, identify areas for improvement, and ensure that buildings are safe, functional, and well-maintained. Here are some common reporting KPIs and metrics used by building maintenance departments: Maintenance Backlog: The maintenance backlog measures the number of pending maintenance tasks or work orders that have not been completed within a specified timeframe. It provides insights into the department's workload, resource allocation, and responsiveness to maintenance requests. Response Time: Response time measures the time it takes for maintenance staff to respond to maintenance requests or service calls. It includes the time from when a request is received to when maintenance personnel are dispatched to address the issue. Minimizing response time helps ensure prompt resolution of maintenance issues and tenant satisfaction...
What Reports Do Fundraisers Use? - Donor Reports: Donor Contribution Summary: Provides an overview of all donations made by individual donors, including the total amount, frequency, and date of contributions. Donor Retention Report: Tracks donor retention rates over time, showing how many donors continue to contribute year after year. Donor Acquisition Report: Displays information about new donors acquired within a specific time frame, helping fundraisers understand the effectiveness of their acquisition efforts. Fundraising Performance Reports: Campaign Performance Report: Evaluates the success of specific fundraising campaigns, detailing the amount raised, expenses, and overall ROI. Event Impact Report: Analyzes the outcomes of fundraising events, such as galas, auctions, and charity runs, including attendance, funds raised, and associated costs. Financial Reports: Income Statement: Provides a comprehensive overview of an organization's financial performance, showing revenue, expenses, and net income. Balance Sheet: Presents an organization's financial position, detailing assets, liabilities, and equity. Cash Flow Statement: Tracks the flow of cash into and out of the organization, helping fundraisers manage liquidity...
What Reports Does a Chief Data Officer Use? - As a data-driven executive, a Chief Data Officer (CDO) relies on various reports to gain insights and make informed decisions. Here are some examples of the types of reports a CDO may use: Data quality reports: CDOs need to ensure the accuracy and integrity of their organization's data. Data quality reports provide an overview of the state of the data, highlighting any issues with completeness, accuracy, consistency, and timeliness. Performance reports: Performance reports track the performance of data systems, applications, and infrastructure. They provide insights into system utilization, response times, and other metrics to help the CDO identify areas for improvement. Compliance reports: CDOs are responsible for ensuring that their organization's data handling practices comply with relevant regulations and standards. Compliance reports provide a snapshot of the organization's adherence to data privacy, security, and compliance requirements. Analytics reports: Analytics reports provide insights into customer behavior, market trends, and other factors that impact the business. CDOs can use these reports to gain a better understanding of the business landscape and make data-driven decisions...

What Reports Would a Developer of Aviation MRO Include? - A developer creating Aviation Maintenance, Repair, and Overhaul (MRO) software would design comprehensive reports to address the specific needs of the aviation industry, particularly focusing on maintenance, operational efficiency, and regulatory compliance. Here are some essential reports that developers might include: Work Order Reports: Overview: Details work orders, including tasks performed, time spent, and materials used. Purpose: Provides a comprehensive view of maintenance activities, aiding in tracking and managing aircraft maintenance tasks. Inventory and Parts Usage Reports: Overview: Tracks inventory levels, parts consumption, and reorder points. Purpose: Assists in inventory management, ensuring timely availability of necessary components while minimizing excess stock. Aircraft Status and History Reports: Overview: Summarizes the maintenance history and current status of each aircraft. Purpose: Offers insights into the health of the fleet, facilitating proactive maintenance planning and decision-making. Compliance and Regulatory Reports: Overview: Monitors compliance with aviation regulations and industry standards. Purpose: Helps ensure that maintenance activities align with regulatory requirements, reducing the risk of penalties and ensuring safety...
What Reports Would a Developer of Accounting Software for Consultants Include? - A developer creating accounting software for consultants would design reports that cater to the unique needs and workflows of consultants, ensuring comprehensive financial visibility and efficient management. Some essential reports might include: Income Statements: Overview: Summarizes revenues, expenses, and profits over a specific period. Purpose: Provides a snapshot of financial performance, helping consultants understand their profitability. Expense Reports: Overview: Breakdown of incurred expenses categorized by type (travel, supplies, etc.). Purpose: Helps consultants track and manage their spending, facilitating budget control. Client Invoicing: Overview: Details of services provided, rates, and total amounts owed by each client. Purpose: Aids in billing clients accurately and maintaining a clear record of transactions. Accounts Receivable Aging: Overview: Displays outstanding client payments categorized by aging periods. Purpose: Assists in monitoring and prioritizing collections to maintain healthy cash flow...
What Reports Would a Developer of Auto Dialer Software Include? - A developer creating auto-dialer software, designed to automate outbound calls, would need to incorporate various reports to provide users with insights into the system's performance, efficiency, and outcomes. Here are some essential reports that developers might include: Call Activity Reports: Overview: Provides a summary of call activities, including the number of calls made, answered, missed, and abandoned. Purpose: Helps users understand the overall calling volume and assess the effectiveness of their campaigns. Call Duration and Talk Time Reports: Overview: Breakdown of call durations and the amount of time spent in conversation. Purpose: Aids in analyzing the efficiency of calls and identifying patterns in talk times. Conversion Reports: Overview: Tracks successful conversions or desired outcomes resulting from the calls. Purpose: Allows users to measure the success of their campaigns in terms of meeting specific goals. Agent Performance Reports: Overview: Evaluates the performance of individual agents, including call success rates and call durations. Purpose: Helps in identifying high-performing agents, areas for improvement, and optimizing workforce management...
What Reports Would an OLAP Server Enable for a Food Distributor? - An Online Analytical Processing (OLAP) server for a food distributor can enable a range of reports and analyses that are essential for optimizing operations, improving efficiency, and making informed business decisions. OLAP technology allows for multidimensional analysis of data, making it particularly valuable for organizations dealing with complex data structures like those in the food distribution industry. Here are some reports that an OLAP server could enable for a food distributor: Sales Performance Analysis: Sales by Product Category: Analyzing sales figures across different product categories to identify top-performing and underperforming items. Sales by Customer Segment: Understanding sales patterns among different customer segments, such as restaurants, retailers, and institutions. Inventory Management: Inventory Levels and Turnover: Monitoring stock levels and inventory turnover rates to optimize the balance between demand and supply. Stockouts and Backorders: Identifying instances of stockouts and analyzing the reasons behind them. Supplier Performance: Supplier Spend Analysis: Analyzing spending patterns with different suppliers to identify cost-saving opportunities and negotiate better terms. Supplier Delivery Performance: Evaluating the reliability and timeliness of supplier deliveries...
What Some Customer Say About InetSoft's Reporting Software - User-Friendly Interface: "InetSoft's reporting software has an intuitive interface, making it easy for users with varying levels of technical expertise to generate insightful reports." Flexible Data Visualization: "The flexibility in data visualization provided by InetSoft is commendable. It allows us to represent complex data sets in a visually appealing and understandable manner." Ad Hoc Reporting Capabilities: "We appreciate the ad hoc reporting capabilities of InetSoft. It empowers us to create custom reports on-the-fly, giving us the agility needed for dynamic business requirements." Interactive Dashboards: "The interactive dashboards in InetSoft's reporting software provide a comprehensive overview of our business data. It's a game-changer for real-time decision-making." Advanced Data Analytics: "The advanced analytics features enable us to delve deep into our data, uncovering trends and patterns that were previously hidden. This has significantly enhanced our analytical capabilities." Scalability: "InetSoft's reporting solution scales seamlessly with our growing data needs. It has proven to be reliable and efficient even as our organization expands...

What Types of Transaction Reporting Are There? - Transaction reporting encompasses various types of reports that document and provide insights into different aspects of financial transactions. These reports serve regulatory, operational, and analytical purposes for businesses, financial institutions, and regulatory authorities. Here are some common types of transaction reporting: Trade Confirmation Reports: These reports confirm the details of a financial trade or transaction between counterparties. They typically include information such as the trade date, transaction type, quantity, price, currency, and settlement terms. Trade confirmation reports are essential for ensuring accuracy and transparency in trading activities. Settlement Reports: Settlement reports document the settlement of financial transactions, including the transfer of funds, securities, or other assets between parties. They provide details on the timing, method, and completion of settlement processes, helping to reconcile accounts and manage liquidity...
What Would a Commodity Manager at a Paper Manufacturer Put in a Custom Report? - A Commodity Manager at a paper manufacturer would create a custom report to provide critical insights and information related to the procurement and management of raw materials and commodities used in the paper production process. Here are the key elements that a custom report for a Commodity Manager might include: Supplier Performance Metrics: Evaluation of suppliers based on key performance indicators (KPIs) such as on-time delivery, quality of materials, lead times, and adherence to contractual terms. Inventory Levels and Turnover: Information on current inventory levels of raw materials, including paper pulp and other inputs. This should be accompanied by turnover rates to assess inventory efficiency. Cost Analysis: Detailed breakdown of costs associated with procuring raw materials, including price trends, volume discounts, freight costs, and any additional charges related to transportation or handling. Demand Forecast and Consumption Trends: Predictions and historical data on raw material demand to help anticipate future procurement needs. This information aids in maintaining optimal inventory levels and avoiding stockouts or overstocking...

What Would a Product Life Cycle Manager at a Printing Press Company Put in a Custom Report? - A Product Life Cycle Manager at a printing press company would create custom reports to monitor and manage various aspects of the company's products throughout their life cycle. These reports help in making informed decisions, optimizing product offerings, and maximizing profitability. Here are the key elements that a custom report for a Product Life Cycle Manager might include: Product Performance Metrics: Performance indicators for each product, including sales revenue, profit margins, market share, and growth rates. These metrics help in assessing the overall success of the product in the market. Sales and Demand Analysis: Detailed analysis of sales trends over time, including seasonality, regional variations, and customer segments. This data aids in demand forecasting and inventory management. Cost Structure and Profitability: Breakdown of the cost structure associated with each product, including production costs, materials, labor, and overhead. This analysis helps identify opportunities for cost reduction and margin improvement. Product Quality and Reliability: Reports on product quality, reliability, and performance in the field. This may include data on warranty claims, customer complaints, and returns. It helps in identifying areas for product improvement...
Where Reports Get Deployed - I would categorize most of the data-intensive industries as having a lot of interest in being able to get information in the hands of end-users. Many organizations are really swimming, and perhaps even drowning, in data. To get your hands around the information, to get your arms and really be able to take impact to how good business decisions are made in a boardroom, in a room that’s outside of the usual analytics that happen where reports get deployed or dashboards get shown and really dig into the insights of how good decisions can get made are certainly where we are seeing a number of industries take form. So examples of this include retailers are actually using this for point-of-sale information. We are seeing this in utilities, for instance, for the Smart Grid that’s emerging and the ability to get information correlated in terms of real-time events that are happening in the Smart Grid where it would be profile or usage information and getting that tied to billing data that exists within the utility’s organization. And so these are many of the industries that we are seeing that continue to adopt and use StyleBI, and a lot of the pervasive BI tools that are continuing to exist in this market...
Which Power BI Dashboards or Reports Should You Use? - The fastest route to a solution, according to someone wise, is simplicity. You'll understand what they meant if you've ever used Power BI. Microsoft's top business analytics solution has an intuitive user interface that makes it simple for anybody to operate. We've spoken about it in great depth, from how workplaces operate to what models are accessible to the general public. This blog article focuses on dashboards and reports, which are what Power BI is best known for. Both will make your life easier, provide you more clarity, and help you make better business decisions. However, there are some variations in how and when to employ them. Continue reading to find out what they are. A Power BI dashboard is described by Microsoft as "a single page, sometimes referred to as a canvas, that tells a narrative using visuals. A well-designed dashboard simply includes the story's highlights on one page so that readers may explore related reports for further information...
Who Chooses MariaDB for Their Database for Reporting Needs? - MariaDB is chosen by a wide range of organizations, from small businesses to large enterprises, across various industries. Here are some examples of the types of organizations that choose MariaDB for their database needs: Startups and Small Businesses: Startups and small businesses often choose MariaDB for its open-source nature, cost-effectiveness, and ease of use. It provides a reliable and scalable database solution without the high licensing costs associated with proprietary databases like Oracle. Midsize Enterprises: Midsize enterprises appreciate MariaDB's flexibility, performance, and compatibility with existing applications and infrastructure. It offers features such as high availability, replication, and clustering, making it suitable for mission-critical applications and workloads. Large Enterprises: Large enterprises with complex data requirements and high transaction volumes choose MariaDB for its scalability, performance, and support for distributed architectures. MariaDB's enterprise offerings, such as MariaDB Enterprise Server and MariaDB SkySQL, provide additional features, support, and services tailored to the needs of large-scale deployments...
Who Uses Online Reporting Software? - Online reporting software is used by businesses and organizations to create online reports and dashboards for their input requirements. These tools allow viewing, creating, and editing reports through a web interface such as a web browser. Some examples of online reporting software include InetSoft, Insight Software, and Power BI. What Kind Of Job Roles Use It? Data analysts are responsible for gathering and organizing large sets of data and then analyzing that data and using their analysis to draw specific business conclusions, whether that's how to effectively price products, cut costs, or improve customer retention. Other job roles that use online reporting software include project managers, engineering managers, technical project managers, business account managers, senior managers in IT and IT infrastructure management. Is There Free Online Reporting Software? Yes, there are free online reporting software tools available such as Qlikview Personal Edition, Qlik Sense Cloud Basic and Qlik Sense Desktop, Sisense for Cloud Data Teams, Google Data Studio, InetSoft, Microsoft Power BI Desktop, Databox and EspressReport Lite...
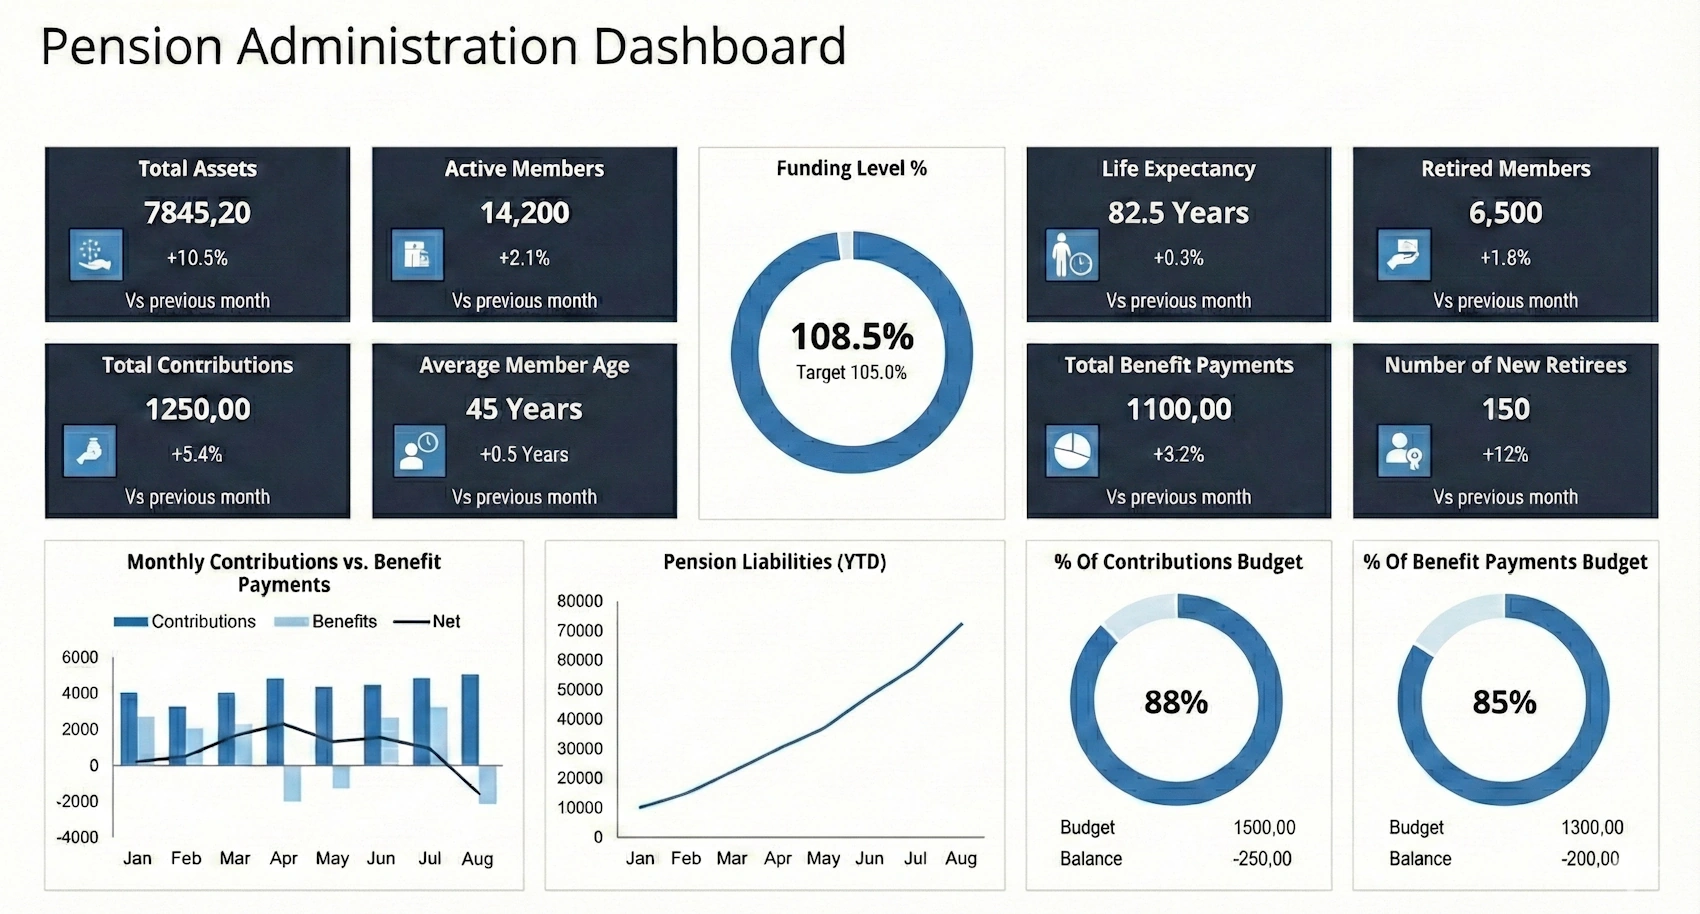
Why Choose InetSoft Over Reach Reporting in 2026? - Businesses seeking robust reporting and analytics tools often compare InetSoft StyleBI and Reach Reporting. Both platforms excel in financial reporting and data visualization, but InetSoft offers broader capabilities for general BI use cases beyond accounting. Reach Reporting focuses heavily on automated capabilities for general BI use cases beyond accounting. Reach Reporting focuses heavily on automated financial reports for QuickBooks users and accountants, while InetSoft provides a more versatile platform for dashboards, analytics, and embedding across industries. Based on 2025-2026 reviews from G2, Capterra, TrustRadius, and Gartner Peer Insights, InetSoft frequently edges out in usability, flexibility, and value—making it a stronger choice for teams needing scalable BI, agile deployment BI without financial-specific limitations. Reach Reporting shines in financial-specific tasks like automated P&L statements, balance sheets, and KPI tracking for advisory services. It integrates well with QuickBooks, Xero, and similar tools, offering AI-enhanced analysis for budgeting and forecasting. However, its scope remains narrow—primarily tailored for accountants and financial advisors handling client reports. Users note limited options for custom templates and slower performance with non-financial data sources...
Why Choose Open Source StyleBI Over Seal Report? - When teams evaluate open source business intelligence and reporting tools, the decision often comes down to more than just generating PDFs or tabular reports. It is about building a sustainable analytics layer that can grow with the organization, integrate with modern data stacks, and empower both technical and non-technical users. In that context, choosing an open source platform like StyleBI over a report-centric tool such as Seal Report can be a strategic move that pays off in flexibility, usability, and long-term value. When teams evaluate open source business intelligence and reporting tools, the decision often comes down to more than just generating PDFs or tabular reports. It is about building a sustainable analytics layer that can grow with the organization, integrate with modern data stacks, and empower both technical and non-technical users. In that context, choosing an open source platform like StyleBI over a report-centric tool such as Seal Report can be a strategic move that pays off in flexibility, usability, and long-term value...
Why Is a KPI Report Superior to a Spreadsheet? - Key Performance Indicator (KPI) reports offer several advantages over using spreadsheets for tracking and analyzing data, particularly when dealing with complex or dynamic data sets in professional sports or other fields. Here are some reasons why KPI reports can be superior to spreadsheets: Real-Time Data Integration: KPI reporting tools often have the capability to integrate with various data sources and APIs, allowing for the automatic and real-time updating of KPIs. In contrast, spreadsheets typically require manual data entry and updates, which can lead to errors and delays in analysis. Automated Calculations: KPI reporting tools can perform complex calculations automatically. They can aggregate, summarize, and visualize data in real-time, eliminating the need for users to create and maintain complex formulas in spreadsheets. Data Visualization: KPI reports are designed for data visualization, making it easier to understand and interpret data trends and patterns through charts, graphs, and dashboards. In contrast, spreadsheets may require users to create and format charts manually. User-Friendly Interface: KPI reporting tools often have user-friendly interfaces that are specifically designed for data analysis. This can make it easier for non-technical users to access and understand data compared to navigating a spreadsheet...
Wistia Reporting Tool - Looking for a good solution for Wistia reporting? InetSoft's pioneering BI application produces great-looking dashboards that mashup video view data with other marketing data in your organization. View a demo and try interactive examples...
Writing a Report Using InetSoft's Query and Analysis Application - So how do you write a report using InetSoft's query and analysis application? Well, it’s very simple to do. You are going to log in, and I’ve already logged into the system, but you see the login/logout on the right hand side. There are multiple levels of securities, so that when you are logging in to the query and analysis tool you’ll only have access to those employees that you have access to in the core system. Once you have done that you can write report to couple of different ways, but today we are going to do it the very simplest and easiest way. We are going to use the query wizard in the top left hand corner. So when you click the query wizard, we will start off and you have a choice. You can run a summary report, or you can run a detailed report. Today we will run the detailed report. The first reporting that we are going to do is the benefits report. This is where we connect the query and analysis tool with your HR database. It also does the variety of other things. It also mashes the data together and does the joint for you and presents it in English, easy to understand format. So you are not looking at the cryptic field names...
YouTube Reporting Tool - Looking for a good solution for YouTube reporting? InetSoft's pioneering BI application produces great-looking dashboards that mashup social media data with other marketing data in your organization. View a demo and try interactive examples...
Zapier Reporting Tool - Looking for a good solution for Zapier dashboard reporting? InetSoft's pioneering BI application produces great-looking cloud-based dashboards with an easy-to-use drag-and-drop designer. View a demo and try interactive examples...
Zendesk Reporting Tool - Looking for an alternative reporting tool for Zendesk? Go beyond Zendesk Explore with greater self-service and personalized reporting, advanced chart types, and the ability to create data mashups with other organizational data outside of Zendesk. InetSoft's pioneering dashboard reporting application produces great-looking web-based dashboards with an easy-to-use drag-and-drop designer. View a demo and try interactive examples...
Zoho CRM Reporting Tool - Looking for a good solution for Zoho CRM dashboard reporting? InetSoft's pioneering BI application produces great-looking cloud-based dashboards with an easy-to-use drag-and-drop designer. View a demo and try interactive examples...