Evaluate InetSoft's Reporting Tool for Zendesk
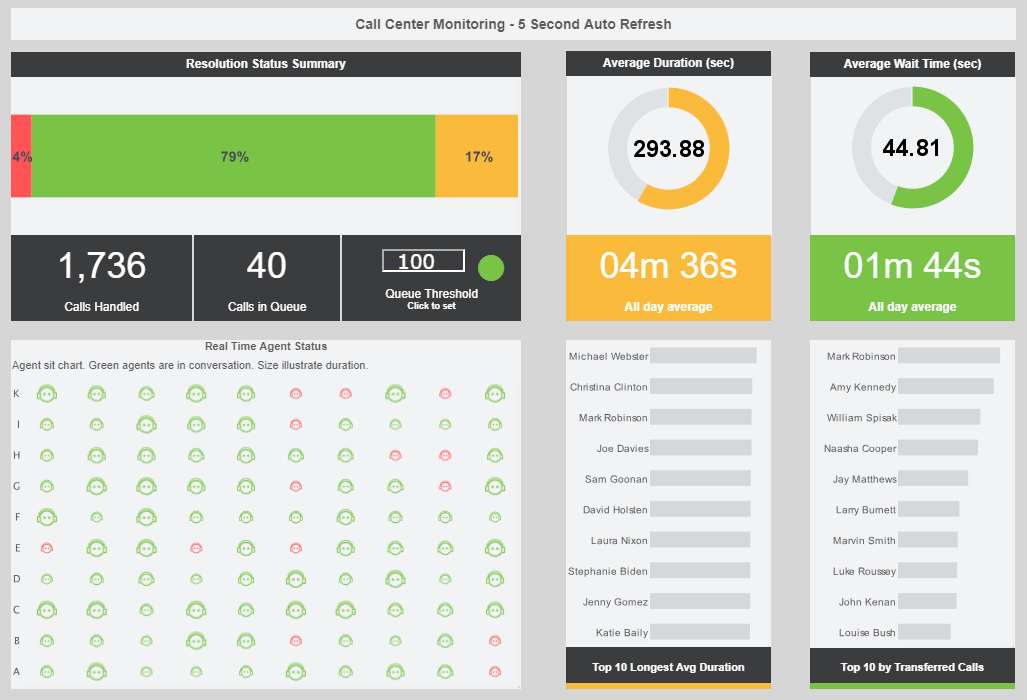
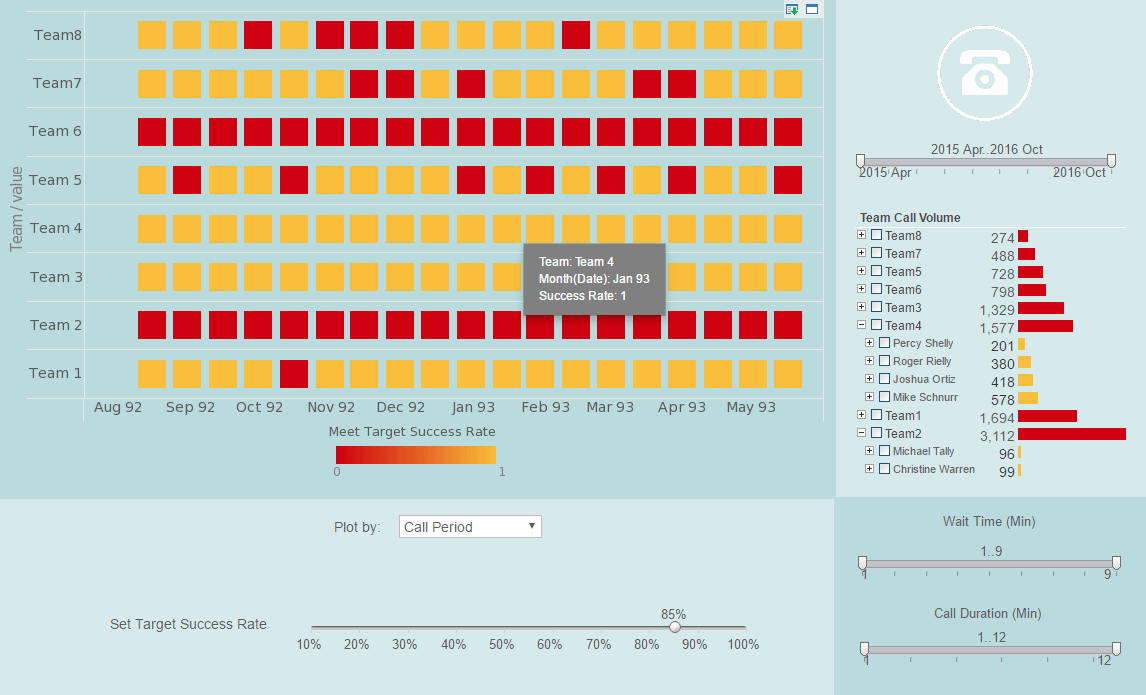
Are you looking for an alternative reporting tool for Zendesk? Go beyond Zendesk Explore with greater self-service and personalized reporting, advanced chart types, and the ability to create data mashups with other organizational data outside of Zendesk. InetSoft's pioneering dashboard reporting application produces great-looking web-based dashboards with an easy-to-use drag-and-drop designer. View a demo and try interactive examples.


Register for more information and a personalized demo
About InetSoft
Since 1996 InetSoft has been delivering easy, agile, and robust business intelligence software that makes it possible for organizations and solution providers of all sizes to deploy or embed full-featured business intelligence solutions. Application highlights include visually-compelling and interactive dashboards that ensure greater end-user adoption plus pixel-perfect report generation, scheduling, and bursting. InetSoft's patent pending Data Block™ technology enables productive reuse of queries and a unique capability for end-user defined data mashup.
This capability combined with efficient information access enabled by InetSoft's visual analysis technologies allows maximum self-service that benefits the average business user, the IT administrator, and the developer. InetSoft was rated #1 in Butler Analytics Business Analytics Yearbook, and InetSoft's BI solutions have been deployed at over 5,000 organizations worldwide, including 25% of Fortune 500 companies, spanning all types of industries.

What Are the Drawbacks of the Dashboard Reports Included with Zendesk?
Zendesk provides built-in dashboard reporting features to help users track and analyze customer support metrics. While these dashboard reports offer several benefits, there are also some drawbacks to consider. Here are some potential limitations of the dashboard reports included with Zendesk:
-
Limited Customization Options: The built-in dashboard reports in Zendesk may have limited customization options compared to dedicated business intelligence tools. Users may find it challenging to create highly customized and tailored reports to meet their specific reporting needs and preferences.
-
Limited Data Visualization Options: Zendesk's dashboard reports may offer a limited range of data visualization options compared to specialized data visualization tools. Users may not find advanced chart types or visualization options, limiting their ability to present data in the most suitable format.
-
Limited Integration with External Data Sources: While Zendesk allows users to connect with external data sources through integrations, the built-in dashboard reports may primarily rely on data stored within Zendesk. Users may encounter limitations when trying to integrate data from other sources or platforms, restricting the scope of their dashboard reports.
-
Scalability Issues: As support ticket volumes increase or data becomes more complex, users may experience scalability issues with Zendesk's dashboard reports. Large datasets or frequent updates may impact report loading times and responsiveness.
-
Limited Historical Data: Zendesk's dashboard reports may have limitations in storing and accessing historical data. Users may find it challenging to access past performance metrics or trends beyond a certain timeframe, limiting their ability to conduct historical analysis and trend forecasting.
-
Dependency on Zendesk Ecosystem: Users who rely heavily on Zendesk for customer support management may find themselves limited by the platform's ecosystem. Integrations with external tools or platforms may be limited, making it challenging to extend the functionality of dashboard reports beyond the Zendesk environment.
-
Data Security and Compliance Concerns: Users handling sensitive customer data may have concerns about data security and compliance when using Zendesk's dashboard reports. Limited control over data access and permissions may pose risks in certain industries or organizations with strict data governance requirements.
-
Limited Sharing and Collaboration Features: While Zendesk allows users to share dashboard reports with team members and stakeholders, the sharing and collaboration features may be limited compared to dedicated reporting and collaboration platforms. Users may encounter restrictions when sharing reports externally or collaborating on report analysis.
-
Cost Considerations: While Zendesk provides dashboard reporting features as part of its subscription plans, users may need to upgrade to higher-tier plans to access advanced reporting capabilities or accommodate larger datasets. The cost of subscription plans may be a consideration for users with budget constraints or specific reporting requirements.
-
Learning Curve: Users may encounter a learning curve when getting started with creating and customizing dashboard reports in Zendesk. While Zendesk's reporting features are designed to be user-friendly, users with limited experience in data analysis or reporting may find it challenging to navigate and leverage the full capabilities of the dashboard reports.
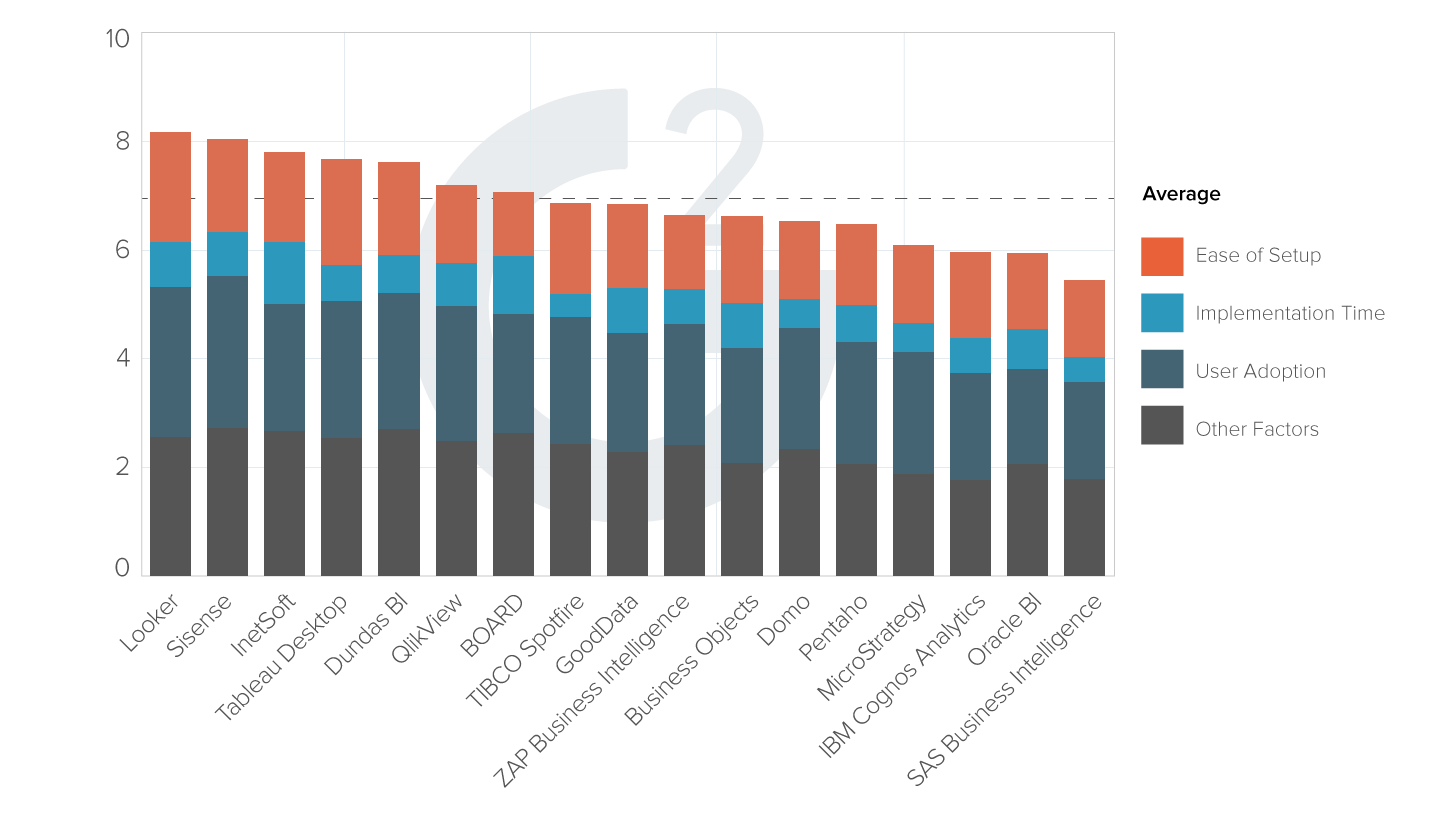
| #1 Ranking: Read how InetSoft was rated #1 for user adoption in G2's user survey-based index | Read More |
More Resources and Articles about InetSoft's Zendesk Reporting Tool
Articles About Dashboard Features - This is a listing of articles about features and benefits of InetSoft's dashboard software that is part of StyleBI, the company's BI platform, or StyleBI, the stand-alone dashboard software product...
Commercial Dashboard Application - The StyleBI by InetSoft provides users with an interactive and intuitive dashboarding tool with the ability to report in real-time. As a Java-based application, it delivers web-based dashboards and visuals. Conveniently, InetSoft's StyleBI design enables data and information sharing within a company...
Choose a Dashboard System - Dashboard systems, also known as dashboard software, provide business users with an intuitive, easy-to-read, easy-to-use tool for monitoring their affairs...
Create an Entire Report Programmatically - Although it is possible to create an entire report programmatically (using just the InetSoft API), the recommended approach is to use the Report Designer to create the report in its entirety. If you need to bind the data programmatically, first create the report template layout in the Report Designer, load it as a ReportSheet object into a Java program and then use the data binding API to bind data to the report elements...
Create Report Scorecard Targets - Report scorecard targets allow users to effectively handle and discern key metrics through InetSoft's visually driven reporting software. View the information below to learn more about the Style Intelligence solution...
 |
View live interactive examples in InetSoft's dashboard and visualization gallery. |
Dashboard to Use in an Educational Setting - Looking to compare and monitor student performance and effectiveness of the educational process? Do you want a business intelligence solution that is flexible enough to use in an educational setting?
Developer API for Reporting - Batch report generation involves first specifying a condition that needs to be satisfied and then an action that must be carried out when the action is satisfied. Using the Enterprise Manager it is possible to use the Scheduler in conjunction with the built-in condition and action classes. The built-in conditions include several time-based conditions: daily, weekly, monthly, a day in a week in a month (e.g. 1st Sunday in March), a day in a week in a year (e.g. 20th Wednesday of the year) and an exact date and time. The built-in actions support creating reports and delivering the output to printers, sending emails, saving in an archive, and generating PDF files...
Dynamic Top 10 Rank Dashboard Feature - Okay so the first question was, can you have a dynamic top 10 rank in a dashboard chart? Yes, absolutely, so the top 'n', in this case 10, can be dynamic...
Developers Using Report Sections - A report section is a container of other elements. In most cases, you add script to the individual elements within the Section, rather than to the Section element itself. However, Section scripts also have some special behaviors, which are discussed below...
 |
Read the top 10 reasons for selecting InetSoft as your BI partner. |
Explore Your Data Without Any Limitation - Some of the new BI technologies, like InetSoft's data mashup, do not require a single rigid database structure. The software, itself, takes care of organizing disparate data sources into the necessary structure for analysis and reporting, you can truly begin to explore your data without any limitation. You can explore any relationships, any what-if scenarios, without previously having had to think about it and plan for it in your data modeling. That's a very powerful technology...
How To Manage the Report Repository - Users of InetSoft's reporting software are able to manage the report repository in order to improve performance and make necessary ad hoc adjustments for ease of use. View the information below to learn more about the StyleBI solution...
Hunt for a Good Alternative to Excel - Executives are always on the hunt for a good alternative to Excel charts because Excel reporting styles are limited, the visualizations are primitive, and analysis is tedious...
InetSoft's Executive Summary Dashboard - Looking for software for making an executive summary dashboard? InetSoft free and commercial dashboarding tools that help you quickly build and deploy attractive, interactive dashboards. Visit the StyleBI product page to learn more, see examples, view a demo, and read customer reviews...
Read what InetSoft customers and partners have said about their selection of Style Report as their production reporting tool. |
Insurance Industry Business Intelligence - Automated parameterized reports keep managers in the know while a robust toolset allows users to weave quantitative analysis, qualitative alerts, and predictive insurance analytics into a seamless process that can effectively increase revenue, control costs, and help to manage risk...
Production Reporting Converged with Enterprise BI - There are two significant trends in reporting technology and markets: convergence and emergence. Production reporting has converged with enterprise business intelligence suites to form a next-generation business intelligence software application. Concurrently, new "lightweight" BI and reporting software has been emerging...
Report Functions nthLargest - This is a continuation of the section that presents functions for Table and Section operations in InetSoft's dashboard reporting software...
Reporting Tool for the Internet - Are you searching for an online reporting solution for your business? InetSoft Technology's StyleBI is a complete BI suite that offers reporting and dashboard capabilities in a zero-client web-based environment. Get...
Read what InetSoft customers and partners have said about their selection of Style Scope for their solution for dashboard reporting. |
Reporting Visualization Tool for Data Scientists - Looking for a good reporting visualization tools for data science? InetSoft is pioneering BI platform offers analytics for ML models built in Spark. View a demo and try interactive examples...
Selecting the Best Web Based Reporting System - Looking for the best web based reporting system? Since 1996 InetSoft has been offering an award-winning Web-based reporting system that generates everything from paginated reports to interactive dashboards. Check out evaluation resources to the left and additional relevant articles below...
Some Cool KPI Dashboard Software - StyleBI makes it easy to chart, monitor, and share all of your KPIs from multiple sources in agile dashboard systems. InetSoft's application, StyleBI, is designed to be as easy as possible to deploy and use...
Structured Reporting Tables - Before creating a new report, you will need to choose one of two layout types, flow layout or tabular layout. The tabular layout is best suited to reports that have rectangular partitions, like a web page using a table for layout. The flow layout is often used for brochure-like reports with multiple columns or fixed panels...
 |
Learn how InetSoft's data intelligence technology is central to delivering efficient business intelligence. |
Type of Metric Reporting - Most BI software provides that type of metric reporting, how many people log in each day, time spent, dashboards or reports created, et cetera. And it is a useful KPI best practice for finding your power users and your laggards. You can now even ask you power users to mentor the laggards...
Usage Analysis Dashboard Example - The Usage Analysis Dashboard here exemplifies the powerful tools and features of InetSoft's interactive web-based analytical dashboard. As a pioneer in business intelligence solutions, InetSoft paves the way for dashboard, reporting, and data mashup solutions for organizations across different industries...
User Report Permissions - With InetSoft's reporting software, administrators can set report permissions that govern the access or limitations of specified users. View the information below to learn more about the StyleBI solution...
Using InetSoft's Report Layout Designer - The report engine uses two report layout models, namely the Flow Layout and Tabular Layout models. This affects the manner in which report elements, placed in the report template, appear when the report is run. In a Flow Layout, the elements are laid out sequentially from top left to bottom right. With Tabular Reports, the report page is divided into grid cells, each cell containing a sequential flow of elements...
 |
Learn how InetSoft's native big data application is specifically designed for a big data operating system. |
Visualization Subsection of Analysis - Visualization is the subsection of analysis that turns data into visible insight. Traditional data visualization tools used to be aimed at highly trained professionals. They used complicated inputs and statistical models to enable their users to discover low-level patterns...
What Are Benefits of Data Mashup - Data mashup is an increasingly important tool for businesses of all sizes, allowing users to gain new insights and spot trends within data. But what exactly is data mashup, and what makes it so valuable...
Which Are the Best Visual Dashboards? InetSoft's dashboards leverage user-driven data mashup, empowering business users with an intuitive monitoring and analytic environment. The ease of use coupled with the sheer power of the software opens the door to enhanced business performance...


