Evaluate InetSoft's Reporting Visualization Tool for Data Science
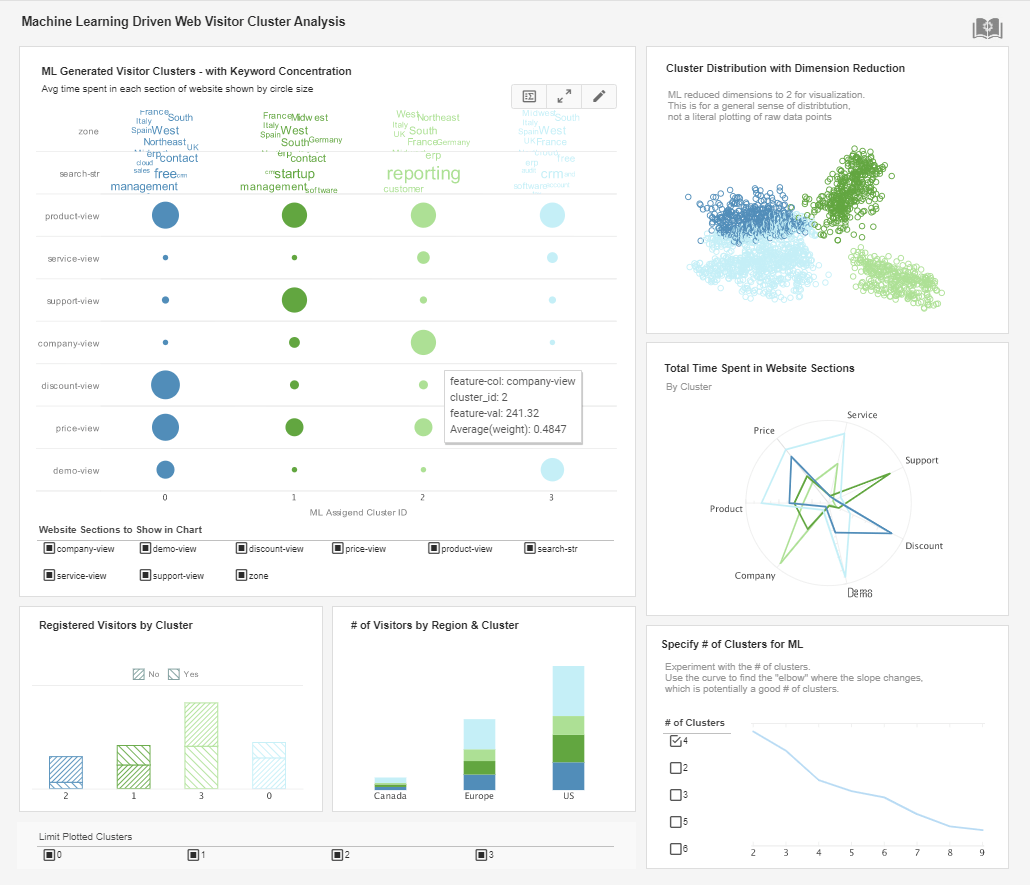
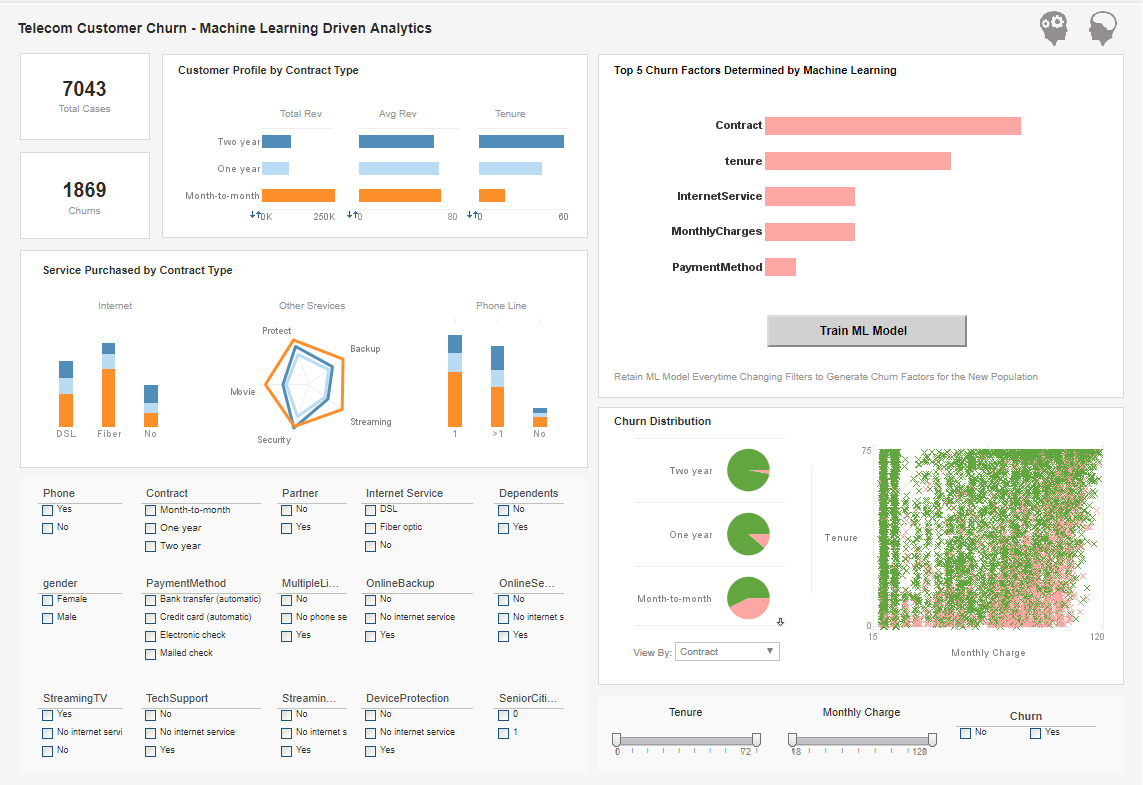
Looking for a good reporting visualization tools for data science? InetSoft is pioneering BI platform offers analytics for ML models built in Spark. View a demo and try interactive examples.

Register for more information and a personalized demo
About InetSoft
Since 1996 InetSoft has been delivering easy, agile, and robust business intelligence software that makes it possible for organizations and solution providers of all sizes to deploy or embed full-featured business intelligence solutions. Application highlights include visually-compelling and interactive dashboards that ensure greater end-user adoption plus pixel-perfect report generation, scheduling, and bursting. InetSoft's patent pending Data Block™ technology enables productive reuse of queries and a unique capability for end-user defined data mashup.
This capability combined with efficient information access enabled by InetSoft's visual analysis technologies allows maximum self-service that benefits the average business user, the IT administrator, and the developer. InetSoft was rated #1 in Butler Analytics Business Analytics Yearbook, and InetSoft's BI solutions have been deployed at over 5,000 organizations worldwide, including 25% of Fortune 500 companies, spanning all types of industries.

More Resources and Articles about InetSoft's
About Visualization Tools - Visualization tools are software applications that allow users to create charts, images, diagrams, or animations to effectively communicate a message. When referring to business visualization tools, we need to creating visual guides of how our business is doing, that is easy understood by any level of employee at your company...
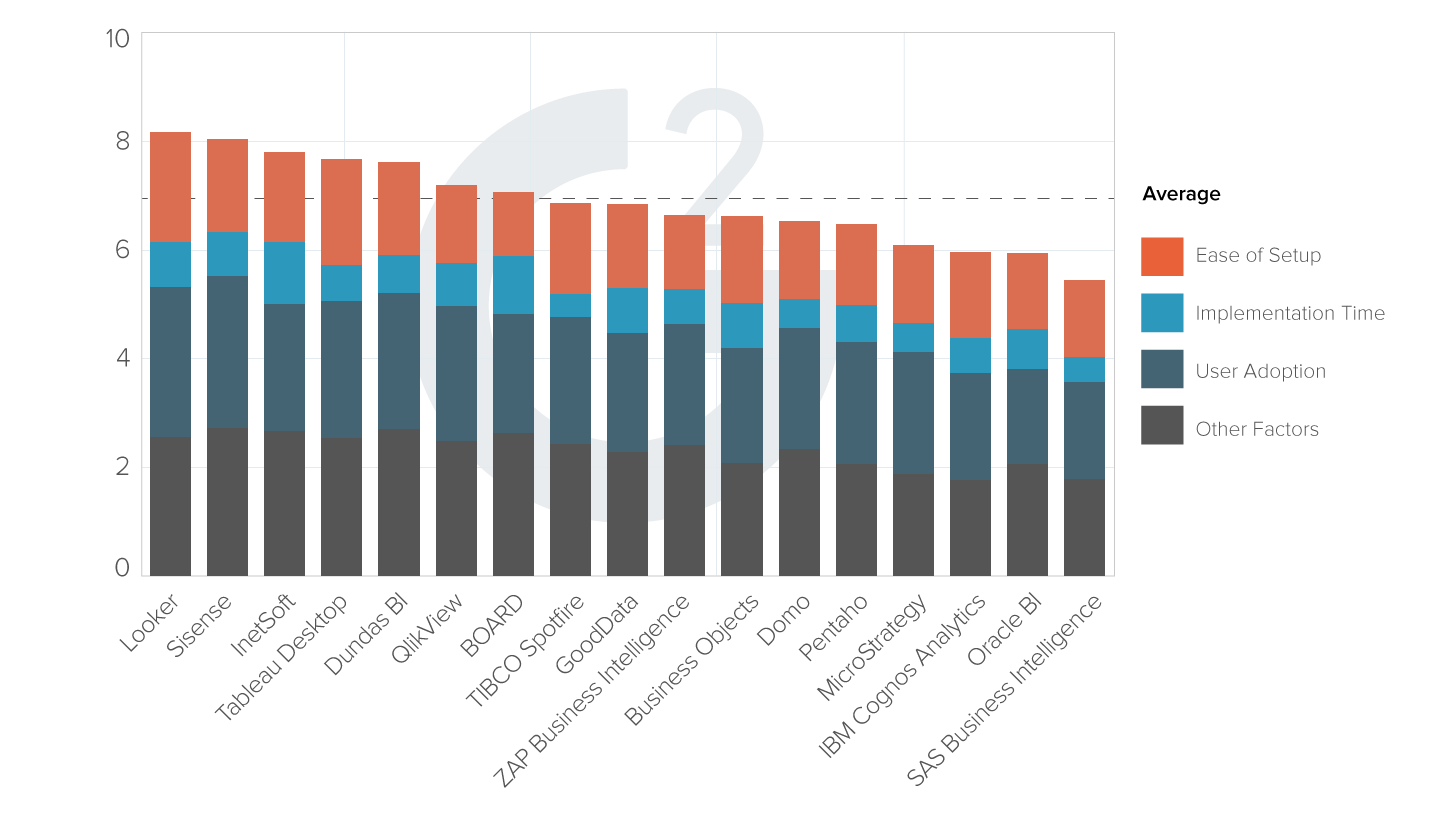
| #1 Ranking: Read how InetSoft was rated #1 for user adoption in G2's user survey-based index | Read More |
Application for Creating a Data Visualization - So I am going to create another data visualization. I think I will simplify it a little bit. I will show you something along the way...
BI Tool for Creating Queries - Traditional methods of database query involve coding SQL queries manually. InetSoft's BI query tool is designed to replace coding to with visual operations so that manually coding queries is no longer necessary...
Big Data Visualization Software - When dealing with big data, it can be difficult to find a software that allows you to present effective visualizations in order to gain greater insight into the information. However, with InetSoft's big data visualization software, users can create pixel-perfect interactive dashboards and reports with just a few simple clicks...
Best Data Monitoring Visualization Tool - I've seen more and more companies using the data visualization tools as a real data discovery window in their operational data base. When you think about the other way people would try to analyze information...
 |
View live interactive examples in InetSoft's dashboard and visualization gallery. |
Business Data Visualization for Machine Learning - Visualization is the subsection of analysis that turns data into visible insight. Traditional data visualization tools used to be aimed at highly trained professionals. They used complicated inputs and statistical models to enable their users to discover low-level patterns...
Dashboards Utilizing Visualization - Dashboards utilize visualization as their primary means of information presentation. Analytic dashboards take this one step further with rich interactivity and self-service customization. Furthermore, data manipulation access should also be provided to data knowledgeable power users...
Easy-to-Use Data Visualization Software - InetSoft's StyleBI is an easy to use, interactive data visualization tool that includes real time reporting capabilities. StyleBI is an edition of StyleBI that focuses on business data exploration by combining Data Block technology with visualization. Visualized analysis is constructed in real-time by dropping data items into visual elements such as charts, metrics and selections. The resulting view reveals the intrinsic relationships among the data...
Dashboards for OLAP Databases - InetSoft's dashboard and data visualization software can access many of the popular OLAP databases such as Oracle Hyperion Essbase, Oracle OLAP, MS Analysis Server, and SAP NetWeaver BW...
 |
Read the top 10 reasons for selecting InetSoft as your BI partner. |
Data Science Platform for Healthcare - we have a sense of your healthcare data science platform. The challenges, let's talk a little bit about how you now take this and apply it...
Data Visualization Applied to Business Intelligence - Data visualization, according to Wikipedia, is the study of the visual representation of data. A closely related term, Information visualization, is defined as: visualization is a process of transforming information into a visual form enabling the viewer to observe, browse, make sense, and understand the information...
Data Visualizer Tool - Companies are employing data visualizer software to transform their raw data into molded information. Data, or raw numbers without context, does not tell a story. It is only when you analyze data that you start to make insights, and the BI industry has found that visualization is the most cost effective way to make data analysis...
Data Visualization Yields Faster Insights - What are some examples of how data visualization yields faster insights? I can think of a few examples in the marketing realm. Day of the week patterns can easily be identified in Web site traffic. Very quickly, looking at a daily traffic chart the troughs on the weekend are obvious, if you're a company serving businesses, for instance...
Read what InetSoft customers and partners have said about their selection of Style Scope for their solution for dashboard reporting. |
Database Visualization Tools - The data that lives in a database tells organizations what their best strategies are, what patterns or trends are emerging, helps them understand where they stand, and more - but only if employees and decision makers can clearly understand the data...
Free Visualization Software for Visual Analysis - If you're looking for free visualization software to perform data mining or explore your data with an easy to use visual analysis tool, try Visualize Free...
Future of Data Visualization Software - we are going in the next year or two in terms of data visualization techniques, technologies...
Good Decision Support System - the biggest promise that data visualization offers is the ability to get some answers to questions that have been eluding organizations for a long time...
Learn how InetSoft's data intelligence technology is central to delivering efficient business intelligence. |
How to Choose the Best Data Visualization Tool? - What do business decision makers look for when choosing the best data visualization tool for their company...
How Easy Is InetSoft's Data Visualization? - Looking for simple and useful ways to view vital information about your business in today's markets? Data visualization may be exactly what you're looking for...
Information for a Visualization Product - This is a table of contents of useful product information about, and benefits of, InetSoft's visualization capabilities built into its business intelligence software for dashboards, reporting, and analytics...
List of Big Data Reporting Tools - What Big Data reporting tools are there? If we have all this data, and we need to do analytics on it. What reporting tools can we use to get the stuff back out? Can we use SSRS which is SQL Server Reporting Services...
 |
Learn how InetSoft's data intelligence technology is central to delivering efficient business intelligence. |
Online Data Visualization - With the use of an online data visualizer, you can transform your raw data into visualizations that are not only easy to understand, but also much more efficient for the entire business...
Setting Up a Data Science Solution - Tell us a little bit about how you're deploying your data science solution. Are you using this all on premise...
Types of Data Visualization Tools - So on those two axes we can start plotting categories of data visualization tools. And the first category is what I would call display visualization tool. And this are what I would say are very simple dashboards that divide one or two layers of data, that will allow objects on the screen to synchronize with each other, update each other...
 |
Learn how InetSoft's native big data application is specifically designed for a big data operating system. |
Visual Analytics Tool Provider - Looking for visual analytics tools? InetSoft offers free and commercial options. The commercial app is a web-based BI platform that can mashup disparate data sources. The free one is also web-based and you can simply upload your data file or spreadsheet and begin visualizing it. Read articles below about InetSoft's BI and analytics solution...
Visualization Tools that are Free - InetSoft has created two free visualization tools that offer productivity to business users and Web developers as well as provide a way to evaluate some of the technology included in the company's commercial business intelligence software for interactive dashboards, visual analysis, charting, and reporting...
When to Replace Tableau for a Reporting Solution? - Is Tableau a reporting tool? No, it does not offer paginated, highly formatted reporting like InetSoft does. As a pioneer in reporting, InetSoft later added dashboarding and advanced data visualization. View a demo and try interactive examples...


