Department BI Dashboards
Are you looking for department BI dashboards? InetSoft's industry pioneering BI platform can support any department's business intelligence needs. View examples in the showcase, read articles about its capabilities below, and Request a Demo.
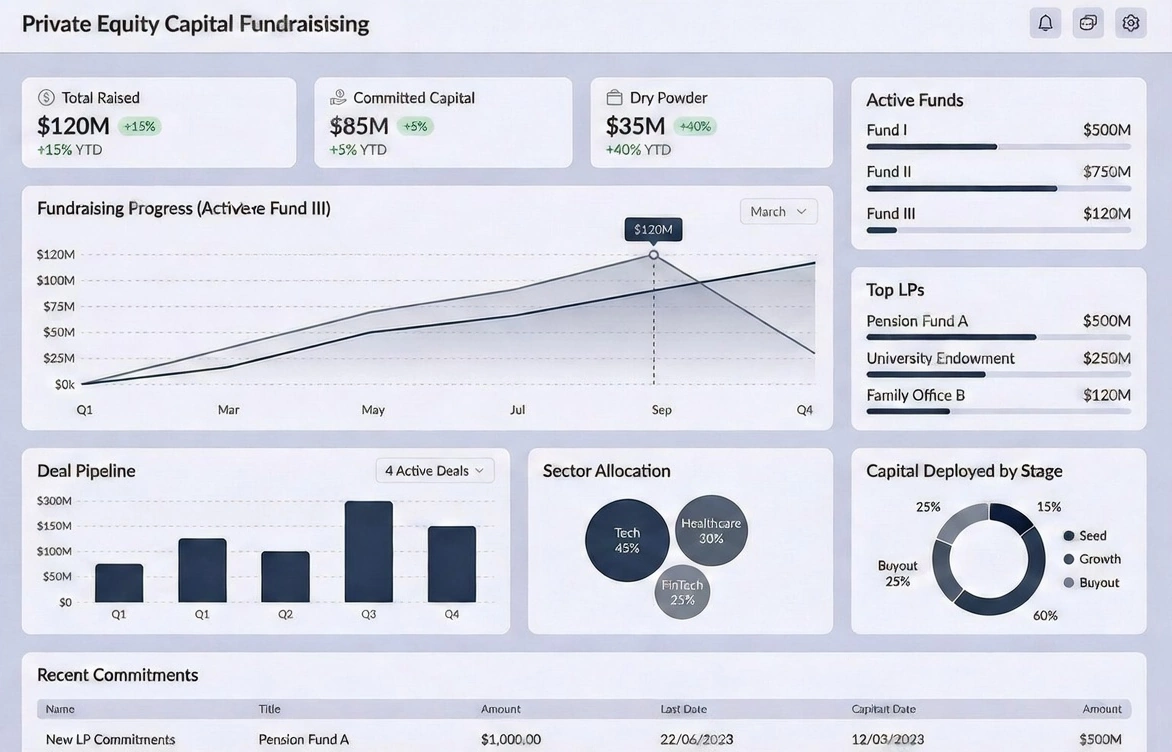
Capital Fundraiser Dashboards - Capital fundraiser dashboards are strategic visual tools designed to track, analyze, and communicate the progress of large-scale fundraising campaigns. Unlike annual fund efforts that focus on recurring donations, capital campaigns typically support major initiatives such as building projects, endowments, or long-term infrastructure investments. These campaigns involve higher donation targets, longer timelines, and more complex stakeholder coordination. A well-designed dashboard transforms raw fundraising data into actionable insight, enabling development teams, executives, and board members to monitor performance, identify risks, and adjust strategies in real time. The primary purpose of a capital fundraiser dashboard is to provide clear visibility into campaign performance. This includes tracking total funds raised against the campaign goal, monitoring pledge commitments, and analyzing donor participation across different segments. By centralizing this information in one interface, organizations reduce reliance on manual reports and spreadsheets while ensuring decision-makers have up-to-date intelligence...
Consulting Industry Dashboards - The consulting industry is a data-driven activity that relies on in-depth analysis of every facet of the business in question. Whether you are a strategy, management, or operations consultant, you need tools to facilitate efficient data processing. Modern-day human resources and financial advisory consulting companies also rely on real-time data acquisition...
Customer Retention Department Analytics - The client sought to create an end-to-end insurance BI solution which would provide insurance companies with access to and analysis of real-time data, so that insurance companies could discover trends and insights across their entire customer base. The client wanted to build their solution from insurance industry standard data models (Acord & OMG) that include line-of-business details such as worker compensation. Incorporating these data models into the solution would allow insurance companies to do consolidated operational reporting and analytics. his InetSoft client needed a flexible fully customizable business intelligence tool, from which the insurance analytics product they envisioned could be built. Insurance Analytics Their customers had huge amounts of data that were stored in multiple systems, which limited access and meaningful use. A BI tool was needed that could join customers' legacy or competing systems data with other pertinent business information like demographics from external social data sources. A tool was needed whose design fit with the client's vision of having the insurance data for both dashboards and reports coming through a single metadata layer, thereby ensuring a "single version of the truth" for all insurance calculations and metrics. The tool also needed to be able to scale up with their customers changing business needs, so that the need to look for a new BI vendor didn't arise in the future...
Customer Service Center Dashboards - As the businesses compete harder, companies are coming up with multiple effective ways to reach customers. In the present day, hardly any businessperson dreams of being in a local business forever. Rather, their primary aim is to reach up to the global customers with their services and commodities. In such a scenario, most companies need to maintain excellent communication with the customers and hire efficient customer care executives. These customer executives make sure that every customer can present their queries and problems before the company. Most of the work takes place over the telephone, and in the majority of the cases, things get resolved easily. However, the above phenomenon is possible due to the presence of dashboards that provide visualized data to the customer service managers of a specific business organization. At present all large and medium businesses and organizations use dashboards at their customer service centers. Furthermore, the BPOs use it too. Here, you can go through the benefits that a dashboard can provide your company in the field of customer service...

Dashboard Software for Application Developers - Are you an app developer looking for dashboard software solutions to monitor your portfolio performance? InetSoft offers a easy-to-use performance monitoring tools that can be deployed in days not months. Like all service providers, mobile app developers need to track monthly and daily active users, ARPU, and churn. Other key metrics particular to application providers are downloads and conversion rates. InetSoft's lightweight dashboard application provides easy-to-use app developer tools to design whatever monitoring and analytical dashboards are desired by the marketing function, finance department, or c-suite. Cohort Churn Analytics Another key area for service providers like app developers is customer churn. Grouping by cohorts of app downloaders or periods of acquisition, comparing retention rates provides insights into application preferences, promotional drivers, and version improvements. This kind of dashboards allows monitoring the stickiness of apps, the ultimate key metric for a solution provider. Other important engagement metrics that can be compared across applications and acquisition periods include conversion rates...
Dashboard Solution for Insurance Industry - The Insurance Claims Dashboard example here demonstrates InetSoft's user-friendly analytical dashboards, perfect for organizations in need of a customizable and interactive software to assist in everyday operations. The particular chart below portrays some of the many tools that InetSoft carries in addition to featuring a multi-dimensional view on the data. InetSoft's solution provides users with a large collection of visualizations and charts to create dashboards that meet their criteria or are easy to analyze. Simplifying the process even further, the point and click environment allows users to easily drill down into their data sets by claim type, claim status, gender, and age for a detailed analysis. With InetSoft's intuitive software, users can quickly build and analyze productive visualizations that sort, filter, and monitor the status of insurance claims and other relevant information while helping them keep track of and achieve long term goals and objectives. Monitor, explore, and analyze by filtering and sorting desired information. Easy to use, modify, and create charts and visuals. Leverage user-driven data mashup. Upload and sift through multi-dimensional data to spot trends and aberrations. Slice and dice data with simple point-and-click method. Share visual analysis with others...

Dashboards for the PMO - Project managers foremost need project progress and coordination information such as dashboards displaying Gantt charts. However, the dashboards must be able to go beyond core project management data to give a holistic view of all factors that can impact on-time, on-budget delivery. Visualization dashboards are the most intuitive ways to understand project information. However, not all dashboards are created equal. InetSoft's web app can easily connect to project management data to create self-service dashboards with rich built-in interactivity and customization. For successfully delivery of projects, project managers must utilize all project related data, for example, supply chain and issue tracking system data. These systems are normally scattered. Some third party data may even be in Excel files. InetSoft's data mashup makes data processing a light-weight, business user self-serviceable process with great efficiency...
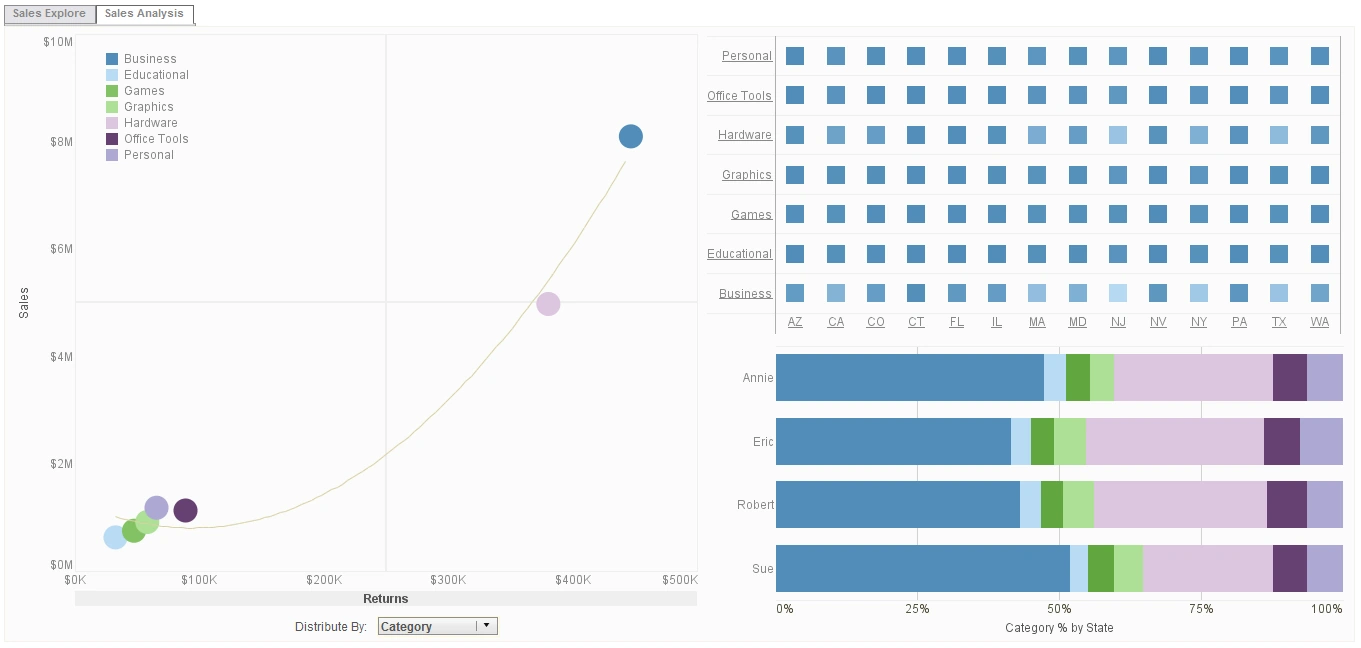
Dashboards for Sales Operations - CRM systems have not only streamlined sales processes but also provide a great data source. However, the CRM database still only covers part of the customer journey. In order to fully develop customer accounts, all customer related data must be marshaled. Management and sales professionals normally depend on professionally-built visualization dashboards and reports for their known business needs. However, no design can anticipate all business questions. Flexible interactivity and ad hoc customization by end users becomes essential for quick business decisions. InetSoft's solution allows not only visual manipulation but also governed access to underlying data. Just like CRM systems, other software such as order management and call center software are also being offered as Software-As-A-Service. And long established and trusted on-premise software are still important for customer related assets. Third party data such as social media often are also critical in understanding customers. InetSoft's web app enables data-oriented sales operations analysts to rapidly mashup this variety of data and extract intelligence that will improve sales effectiveness and maximize cross selling...
Department Dashboard Templates - Looking for department dashboard templates. Get inspired from these examples created with InetSoft's easy-to-use web-based dashboard application...
Departmental KPI Examples - Key Performance Indicators, or KPIs, are business metrics that are used to track an organization's performance. Any industry, government agency, or non-profit organization needs to measure its performance on a daily, monthly or quarterly basis, and key performance indicators are those statistics that are deemed important to track in order to meet business goals or organizational objectives. InetSoft is a business intelligence software provider who makes dashboard and reporting software that is most often used to track business performance, comparing actuals to forecast or target. In general no software application is going to provide KPI's ready-to-use, since KPI's are metrics that are often derived from formulae that are specific to an enterprise in many cases, and in all cases the data that make up the KPI need to be mapped into the software application. However, InetSoft's application, StyleBI, is designed to be as easy as possible to deploy and use. Examples of KPI's. To visualize how some common KPI's can be charted and analyzed in InetSoft's application look at the example screenshots below. This KPI example come from InetSoft's dashboard and reporting solution for salesforce.com, and can easily be built with InetSoft's on-premise business intelligence software application, Style Intelligence. The Marketing Department of any products or services company needs to track leads as one of its KPIs. This screenshot shows the weekly count of the number of new leads generated. In addition, thanks to multi-dimensional charting of the source of leads by colors in the vertical bars, the reasons for a KPI's increase or decrease can be seen. The checkboxes to the right provide simple point-and-click access to filtering to explore further the reasons for change, or for slicing and dicing different campaigns, so that multiple KPIs can be tracked in a single report...

eCommerce Analytics Usage - It is a shame that so many ecommerce websites are still not making adequate use of data analytics. It is like leaving money on the table. There Is Data Everywhere -- Use It If you were a physical retailer, you would have to work hard to collect enough meaningful data to get your management information systems (MIS) to turn out actionable recommendations. But in the case of online retail, data logs are updated every time your customer interacts with your website. Fancy Marketing Strategies Can Wait, First Focus on What the Customer's Actions Are Telling You I'm sure you want to tap into visual marketing, content marketing, seasonal marketing, and other advanced eCommerce marketing strategies. But before you do that, why not simply evaluate the way customers interact with your website, and use that to guide your actions. Of course, it is possible to get overwhelmed by analytics. So let us look at the basic analytics data that you need to focus on...
Educational Institutions' Dependence Upon Data - Data is everywhere. For educational institutions, using business intelligence tools can seem like drinking from a fire hydrant. There is such a wealth of information coming from all directions without enough resources to manage it all. This results in the data getting lost along the way. Like other major industries such as healthcare and manufacturing that have fully embraced business intelligence, the education sector is realizing the need to depend on data. While schools and universities tend to be reluctant to make investments in technology, things are changing as educators ditch traditional holistic approaches for business intelligence. It is essential to think how to maximize results and bring about a positive change to make the most of business intelligence. Since education facilities are not unique, it is possible to use the tools to attain success. The insights generated can be used for a variety of purposes. This article takes a close look at the top three ways business intelligence can be used in education for bringing results...
Enrollment Department Dashboard Example - Universities and higher education institutions are typically thought of as places where information and data disseminate from. However, from a business intelligence perspective, there is also a large influx of data at these types of institutions. For example, universities collect and store datasets regarding student demographics, academic performance, housing status, meal plans, academic departments, class enrollment levels, and other important information. To help manage all these variables, and make the best use of available resources, many universities deploy business intelligence tools. By leveraging business intelligence tools, university staff and administrators can convert all their raw data into visually intuitive dashboards. Universities can compare and monitor student performance and gauge the effectiveness of the educational process. The right business intelligence solution should be flexible enough to be used in an educational setting and robust enough to provide powerful data mashup and drill down capabilities. Data mashup enables users to compare disparate data sources and drill down capabilities allow users to pinpoint problem areas...

Example of a Customer Service Center Dashboard - Call center dashboards are needed in order to monitor key metrics that can change on a minute-to-minute basis. Therefore, data needs to be accessed in real time and be readily available to all team members throughout the day. InetSoft offers companies a comprehensive solution to tracking key metrics such as success rate, productivity, service level, and more in order to increase company efficiency and decrease overhead costs. When using a dashboarding software, it is important that all necessary information can be displayed in an understandable, comprehensive manner as it is in the call center dashboard example to the right. At a single glance, the user can clearly use the heat map visual to see where there have been successful or unsuccessful calls based on where there are yellow or red dots for each team and month. This gives the initial overall view so that the user can get a general idea of what is going on. With InetSoft's dashboarding software, users have the ability to create dashboards that are both compelling and informative at first glance as well as through multiple methods of data drilldown...
Finance Department Dashboard Solution - Finance departments arguably face a wider set of information management challenges than any other department in an organization. Some of the challenges are common across functions, but several are specific to Finance. Finance Departments face many challenges that interfere with gaining Data Intelligence: 1. A Multitude of Disparate Data Sources – Finance owns the accounting and financials data, but also needs to access data from every other function, from the CRM system, to the supply chain system, to the transactional and operational databases, and even marketing and HR systems. Outside of these is staff generated data stored in spreadsheets, whether they are forecasts, performance trackers, or special analyses. Ultimately all of this information needs to be mashed up to get the whole picture. 2. Limitations of Tabular Reports – The first generation of information reporting has been the tabular report, whether structured as in financial statements or essentially print-outs of a database. These are useful for presenting the facts, but not for telling the story. Not until those data dumps are imported into a spreadsheet, massaged into metrics, and turned into charts can analysts begin to tell stories about the data. 3. Too Many Reports – Relying on reports also leads to ever growing libraries of static reports as new ones are requested for each new question that comes up during the course of running the business. The libraries become overrun and disorganized, leading to potential confusion and errors, and certainly inefficiency. 4. Too Much Manual Reporting – Without self-service access to data, staffers make their own reports, importing, or even worse, copying and pasting data into spreadsheets and creating their own reports. This leads to more inefficiency, and worse: errors. 5. Spreadmarts – With operational data stores being so hard to change and not suited to key metric calculations and aggregations, finance staffers often resort to creating their own spreadsheet "databases." No longer tied to the systems of record that might be updated over time, the result is competing versions of the truth. 6. Dependency on Data Scientists – the era of Big Data means there is an ocean of data that potentially could be analyzed, but most organizations don't have the expertise to tackle the challenge...
Financial Reporting Department Software - Finance departments are challenged everyday with more reporting demands by executives, boards and external agencies. This diverse audience also increasingly wants more transparent and quicker responses. On the other hand, CFOs want more analysis to discover opportunities and insights. Visualization dashboards with rich interactive functions empower finance professionals with unprecedented self-service information and exploration. This, in turn, minimizes follow-up explanation otherwise needed by information consumers. Machine learning uses accumulated data for forecasting, the discovery of irregularities, and for auditing. It not only saves finance professionals precious time but also delivers findings that are hidden in data. InetSoft's data intelligence software further provides pixel-perfect document reports. Document reports are especially suitable for dual online and offline use. When used online, a document report is live with interactive functions such as streaming, searching and page jumping. The paginated nature of document reports allows large amounts of formatted information be delivered to customers or external entities easily. The finance department interacts with many areas. Consolidating data from various systems and departments can be a very challenging task. This often is the source of spreadsheet hell that breaks data lineage and causes inconsistent reporting. InetSoft's data mashup technology is an elegant solution...
Food Industry Uses Analytics - The food industry is a highly competitive one with over a million restaurants in the United States alone. Because of this there is a huge emphasis on innovation and adaptation. The biggest adaptation has to be turning to food eCommerce, especially as countries go in and out of quarantine. Since word of mouth doesn't exactly work as well online, that's where data science and analytics come to the rescue. The average customer has certain needs that need to be met in order to have a positive experience in a restaurant or when ordering online. Things like on-time delivery and guaranteeing fresh produce is ethically harvested are important management goals. Here we will explore some of the ways Big Data and the uses of analytics can help food industry managers excel...
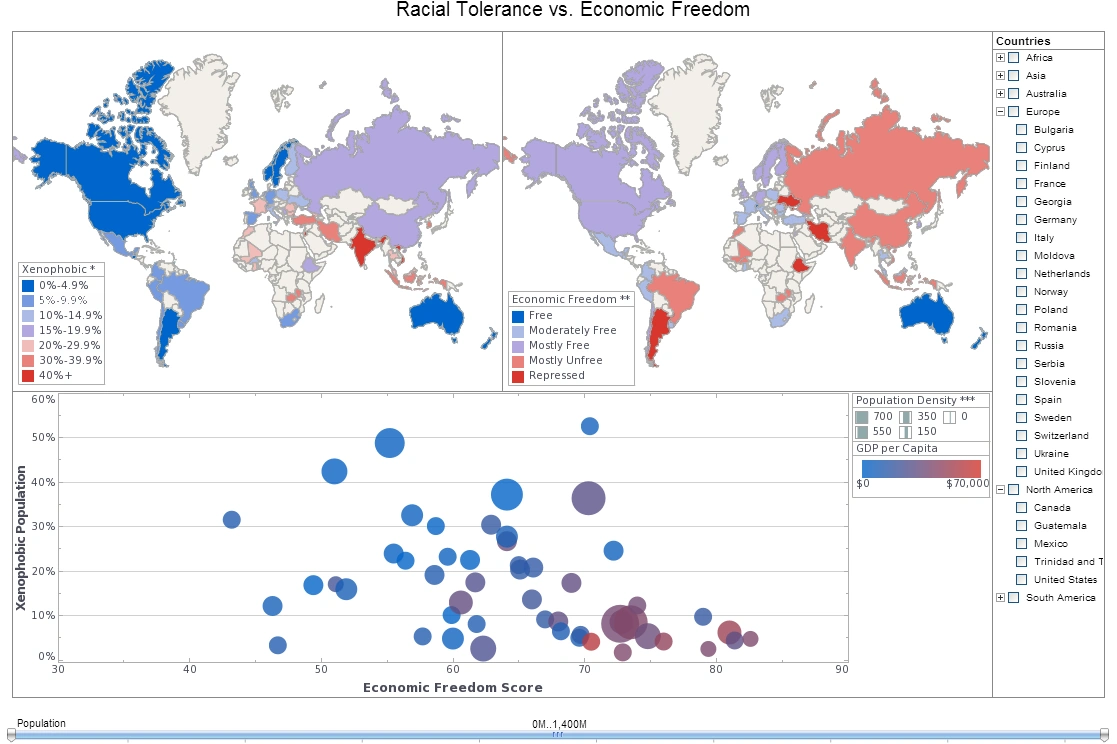
Health Information Dashboard Example - The Health Information Dashboard below is an example of one of InetSoft's interactive web-based applications for healthcare companies. This particular chart allows users to monitor and research health information by geography. With a point and click environment, users can drilldown into health information by state, specific health concern, or population for an accurate analysis on one unified screen. With InetSoft's easy-to-use drag and drop design tools, healthcare companies can quickly build productive analytical tools like this one, that aid users in day-to-day operations, as well as help them keep track of and achieve long term goals and objectives. InetSoft has a library of charts and visualization types to choose from, including geographic mapping, heat maps, and scatter plots. Healthcare industry executives can cater any completed dashboard to specific needs at any given time and even access them from mobile devices such as smartphones and tablets...
HRM Dashboard Solution - The human resources department manages the most important asset of any organization. In order to attract and train new hires and retain productive employees, HR professionals must take full advantage of treasure hidden inside their data. InetSoft's rich interactivity and customization empowers every HR user with self-service analytics that require zero training. These self-service functions allow every user to answer one-off or any unanticipated questions. The freedom to explore data opens the door for all HR professionals to become data-based innovators. InetSoft's analytic web app enables data-oriented HR professionals to self-serve their data intelligence needs. The web app combines data mashup with visualization into an intuitive process. It can mashup data from enterprise databases with ad hoc Excel spreadsheets and instantly turn the result into visual dashboards...
Informatics Analytics Dashboard - In healthcare there is an immense amount of data to manage and keep track of. Not only do you need to monitor patients medical histories but there is a large and ever increasing demand for appointments which leads to scheduling and employee data metrics. Healthcare IT also encompasses many other critical facets including security measures in electronic health records. This is why the health informatics profession is vital for maintaining a viable healthcare system. Healthcare informatics is a multidisciplinary field that uses information technology to manage patient healthcare information for effective clinical use. Having the ability to visually analyze all of these various data sets requires more than what can simply be done with excel, and top security measures are a key component in ensuring patient safety and satisfaction. Security has developed into a major topic of concern in the health industry due to the use of electronic health records (EHR). EHRs are used because of their ability to maximize patient efficiency. Since security is critical for protecting sensitive data, InetSoft offers a wide array of security features with their business intelligence software that is known for its ease-of-use and robust performance...