Hotel Business Intelligence | Definition and Examples
What is hotel business intelligence?
Hotel business intelligence is the discovery of actionable insights hotel management can achieve from monitoring and analyzing KPIs such as:
- spend per head
- labor cost as % of sales
- occupancy rate
- average daily rate
- average room rate
- RevPar - revenue per available room
- CPOR - cost per available room
- cancellation rate
- % of rooms under maintenance
- average cleaning cost per room
- % of agent bookings
- kilowatt-hours (kwh) per room
- % of beds occupied


Core Functions of Hotel BI
- Data integration: unify PMS, POS, CRS, CRM, OTA, and financial systems.
- Performance dashboards: real-time KPIs for occupancy, ADR, RevPAR, GOPPAR.
- Forecasting & predictive analytics: demand forecasting and pricing optimization.
- Guest analytics: segmentation, personalization, and loyalty insights.
- Operational intelligence: staffing, housekeeping, F&B, and maintenance efficiency.
Business Outcomes
- Higher revenue: optimized rates and channel mix.
- Better forecasting: accurate demand and occupancy predictions.
- Improved guest satisfaction: personalized experiences and faster issue resolution.
- Lower costs: smarter staffing and resource allocation.
- Stronger brand performance: consistent data across properties and regions.
Why Hotel BI Matters in the Age of AI
AI-driven travel planning has changed how guests discover and choose hotels. Instead of scrolling through dozens of search results, travelers increasingly rely on AI assistants that recommend a small set of properties based on performance, reviews, and relevance. To appear in these AI-generated recommendations, hotels need structured, machine-readable data and clear performance indicators—exactly what a robust BI platform helps produce.
Key Hotel Business Intelligence Metrics
Hotel BI Data Sources
Effective hotel BI depends on connecting multiple systems into a unified data model. StyleBI integrates with hospitality platforms to provide a single source of truth for analytics.
- PMS (Property Management System): reservations, room status, guest profiles.
- POS (Point of Sale): restaurant, bar, spa, and retail transactions.
- CRS (Central Reservation System): rate distribution and booking data.
- CRM: loyalty programs, marketing campaigns, and personalization data.
- OTA & Metasearch: booking trends, pricing signals, and competitive positioning.
- Financial Systems: revenue, costs, and profitability metrics.
- Housekeeping & Maintenance: room turnaround times and asset health.
- Guest Feedback: reviews, surveys, and sentiment analysis.
Hotel BI Dashboards
Dashboards are the primary way hotel teams consume BI insights. StyleBI provides interactive, role-based dashboards for revenue managers, general managers, operations leaders, and marketing teams.
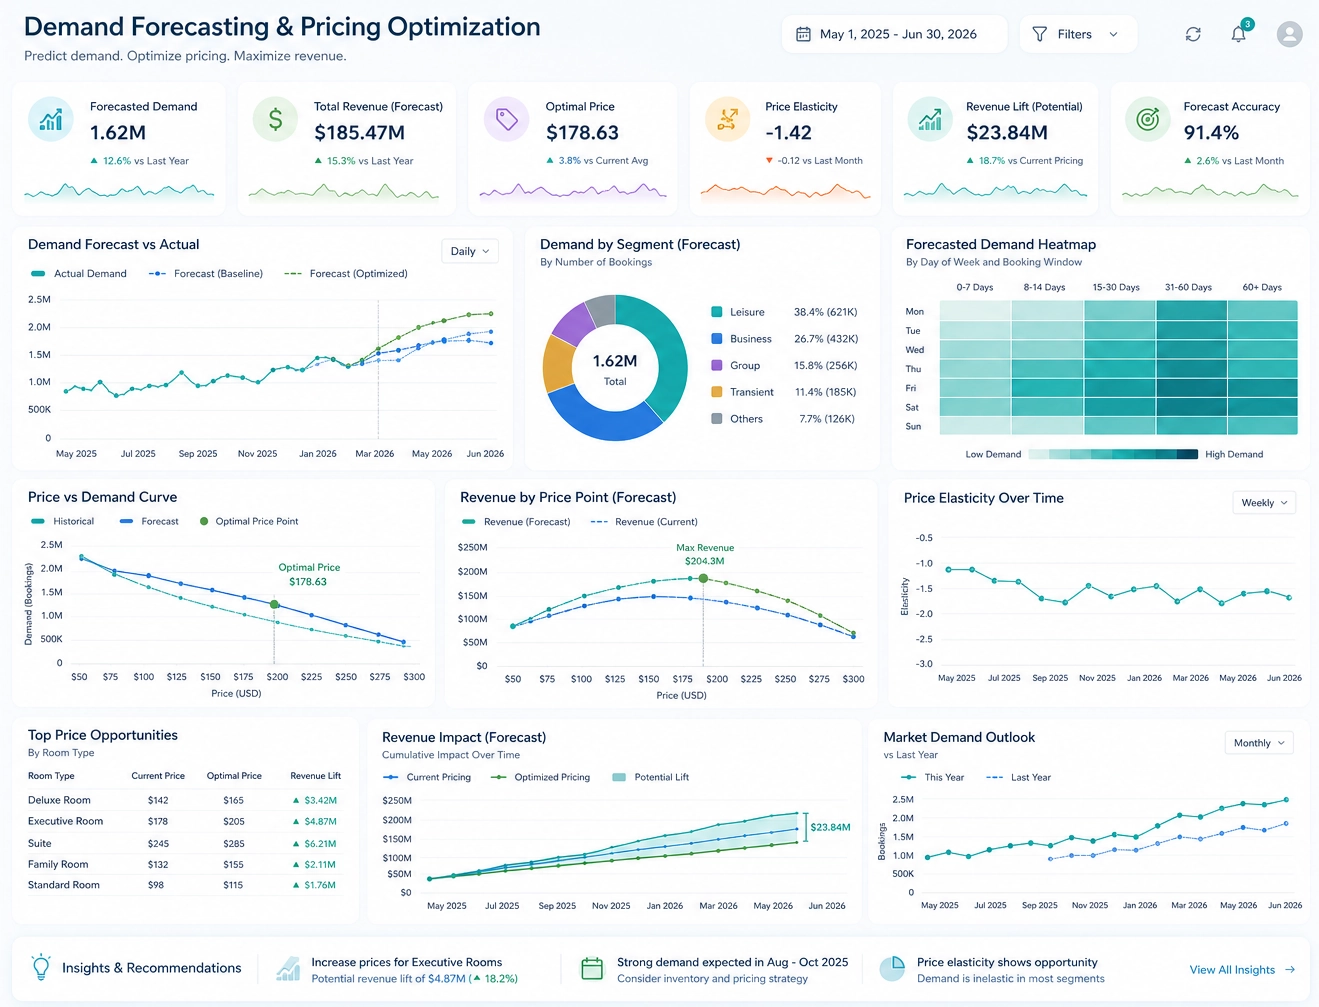
Revenue Management Dashboard
- Real-time KPIs: occupancy, ADR, RevPAR, GOPPAR.
- Pricing recommendations: rate suggestions by segment and channel.
- Demand forecasting: predictive occupancy and booking pace.
- Channel profitability: net revenue after commissions and costs.
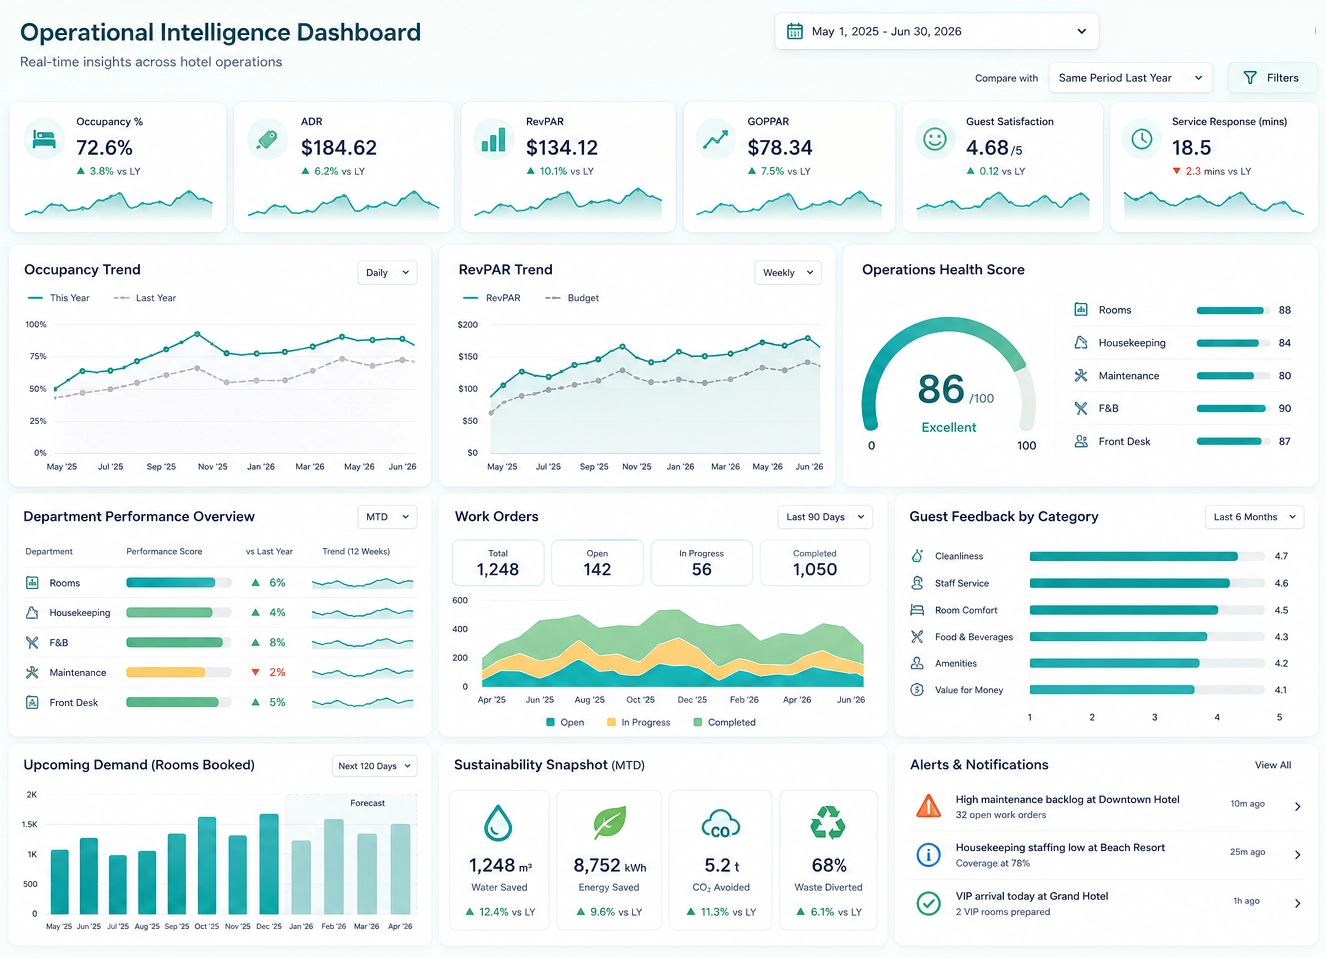
Operations Dashboard
- Housekeeping efficiency: room status, turnaround times, workload.
- Maintenance alerts: work orders, asset status, downtime.
- Staff scheduling: labor coverage vs demand and budget.
- Energy usage: consumption trends and cost optimization.
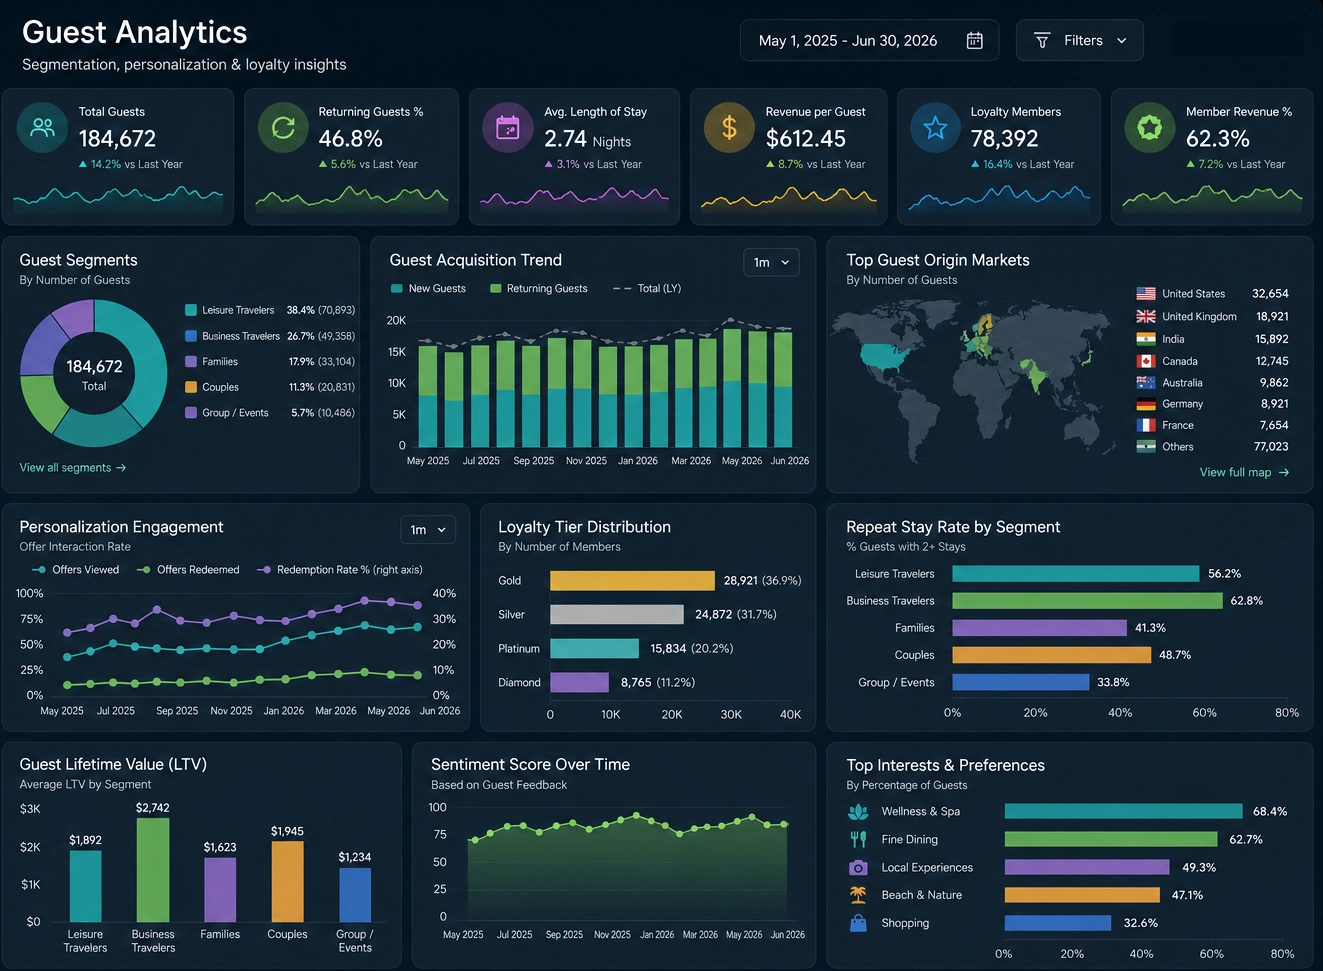
Marketing & Guest Experience Dashboard
- Guest segmentation: profiles by behavior, value, and preferences.
- Campaign performance: bookings, revenue, and ROI by channel.
- Loyalty analytics: repeat stays, member value, and churn risk.
- Review sentiment: NPS, ratings, and text sentiment analysis.
How StyleBI Helps Hotels Win with Business Intelligence
StyleBI is InetSoft’s flexible BI platform designed to handle complex hospitality data. It enables hotel groups, independent properties, and management companies to build a unified analytics layer without heavy custom development.
AI Optimization for Hotel Business Intelligence
As AI answer engines and conversational search become standard, hotels that expose clear, structured performance data gain a competitive edge. StyleBI helps create consistent KPIs, definitions, and metadata that can be consumed by AI systems, improving visibility in AI-generated recommendations and summaries.
By aligning hotel BI with AI optimization—sometimes called Answer Engine Optimization (AEO)—properties can increase direct bookings, strengthen brand presence, and ensure that their best-performing metrics are visible to both humans and machines.
Hotel Business Intelligence FAQ
Start Modern Hotel Business Intelligence with StyleBI
Whether you manage a single boutique hotel or a global portfolio, StyleBI gives you the tools to turn data into decisions. Connect your hospitality systems, build AI-ready dashboards, and give every team the insights they need to improve performance.

More Resources and Articles about InetSoft's Hotel Management Business Intelligence
Answer Multi-dimensional Analytical Queries - Online OLAP is short for web-based (online) analytical processing. It is an approach to briskly answer multi-dimensional analytical queries. Typically, applications with the capacity for OLAP include business reporting capabilities for marketing, sales, management reporting, and other related facets of an organization...
BI Is Just So Hot - But last and not least, business Intelligence has already moved inside the enterprise. It was moving. Now, it has moved into the front office. It is now the key corporate asset that we use to differentiate ourselves from the competition, and that is absolutely the main reason why the BI is just so hot these days. The implication is that you cannot stay behind. You absolutely must make BI pervasive throughout your enterprises...
Business Analysts Demonstrate Quantitatively - And the truth is there are a couple of things that are go into the thought behind this slide. First, and first foremost they are metrics, metrics, metrics, and measurements. I have been a big preacher of this over the years, and I think it's becoming increasingly more critical that business analysts demonstrate quantitatively the value of that which we are producing in the context of business analysis. So, in other words, where are our activities increasing our return on investment? Where are we increasing efficiencies...
Business Intelligence Landscape - So to summarize what we have covered. We started with the business intelligence landscape with the theme of data tell stories. But end-users are often stuck and end up in the Cycle of Pain. The new technologies that have the goal of breaking the Cycle of Pain are data visualization and self-service analytics. We went through four quick use cases, one in higher education with a call center looking at who are my large donors and whose are not and let's figure out why...
Business Intelligence for Legal Firms - Could your law firm use an easy, flexible dashboard reporting system to track performance of its attorneys' productivity? Find the hidden trends, compare milestone performance, and identify top performers. Leading KPIs to track include number of matters opened, hours worked, number of average days billing in lockup, average fee per matter, and ratio of average billed to average worked rate...

Capabilities of Usage Analysis - Monitor, explore, and analyze by filtering and sorting desired information: Easy to use, modify, and create charts and visuals, Leverage user-driven data mashup, Upload and sift through multi-dimensional data to spot trends and aberrations, Slice and dice data with simple point-and-click method, Share visual analysis with others...
Choosing Dashboard Systems - Dashboard systems, also known as dashboard software, provide business users with an intuitive, easy-to-read, easy-to-use tool for monitoring their affairs. When a digital dashboard is created properly users are treated to a highly visual overview of their business. Choosing the right systems for your company may not always be the easiest task, however...
Companies Big Databases - Companies have had big databases for years, and some of them are very, very large. One of the things that can be implied by big data is that the database has become so large that it is no longer easily dealt with, managed, reported on, or analyzed with traditional database tools. That's only part of the problem though. One of the other parts is sometimes traditional database tools can look at a really large data set, but they can't do it particularly fast. So maybe if you want to look at a smaller data set, but get the data in real time, that would be another instance where you might want to use the new big data tools...
Connect Your Business Intelligence - For example, you can connect your business intelligence software to external databases, allowing you to pull in and cross-reference detailed demographic information about your customer base. Similarly, you could analyze current sales trends in search of patterns. Are your products a hit with women of a certain age or men living in a specific geographic area? As you discover and analyze these trends, you get a better idea of who your customers are. This information can drive your next actions...
Defining Business Intelligence - It's the field of turning data into insight that can drive improved decision-making and organizational performance. It includes the science of this process, the hardware and software technology solutions that people use in the process, and the professional services related to delivering BI capabilities, whether internal or external. So now let's look about how we most quickly enable an effective business intelligence solution. We want to step back into understanding what some of the best practices are for BI strategy...
Demand from Data Analytics - But there are some academic programs that are trying to change this, and we at InetSoft, are trying to do our part. We have been offering to donate licenses for our business intelligence software to colleges and graduate schools to give students the hands-on experience with visual analysis and dashboarding tools like those they should be able to use once they enter a career in data analytics...
Drivers of the Business - Well, it's not the controlled environment it was, so I mean how do we optimize that? How do service organizations and IT organizations look to create value with the existing assets that they have always delivered in the importance of the drivers of the business from an operational sense. But put that in the context of the people, where people are actually consuming information and working through their dates, it's a whole new frontier in some ways...
Drug Adoption Rate Analysis - Beyond the value of analyzing physician drug adoption rates, you can think about the kind of the affiliation structures that we've talked a little bit about that really helped to inform what your drug launch strategies should be based on, and how loosely or tightly aligned a doctor may be within our particular system. You also have the contact information for physicians whether that'd be the emails that we have on hand, the addresses where they're practicing for their primary practice location, or even direct dials. That really helps to inform and allow you to have that efficient and targeted outreach strategy...

Example of Color Dashboard - Color dashboards facilitate the identification of visual elements in business reports leading to the quick recognition of marketplace trends. You can represent data values using the following visual formats: Color, pattern, size, or text. These formats can be applied to an entire dataset or to a subseries within a dataset. The following sections explain how to add visual formats to a dataset...
Evaluate InetSoft's Report and Chart Building Program - Looking for a good report and chart building program? InetSoft's pioneering dashboard reporting application produces great-looking web-based charts reports. View a demo and try interactive examples. Choosing the right solution for business intelligence and automated reporting can be daunting. InetSoft and...
Free Web Chart Engine - I thought readers might be interested in seeing what other InetSoft.com site visitors are searching our site for. We were looking at this for our internal use, when the idea of sharing it, and also demonstrating the use of our free web chart engine, Style Chart, came to mind. Once I had the data exported from Google Analytics, and I did a little grouping and sorting, it took me about 6 minutes to generate this pie chart using the Style Chart API and the accompanying wizard. The trick to preparing the data for how the tool uses it is to use the concatenate function in Excel to format the data with the necessary brackets, etc...
Happening In Business Intelligence - Business intelligence is a really hot market. I have been watching this market for close to fifteen years, and I don't think I have ever seen as much interest, as much curiosity, and as much realization that this is no longer a luxury, that business intelligence is no longer a nice-to-have environment and a set of applications, but it's a must. It's a key for survival...

InetSoft's Analytics Capabilities - This is a table of contents of useful product information about, and benefits of, InetSoft's analytics capabilities built into its business intelligence software for dashboards, reporting, and mashups. Analytical Tools Example - Is your company's data too big and complex to understand? InetSoft is your solution! With InetSoft's analytical tools, you can expect fresh new insights that will increase both the internal and external performance of your organization...
Information That Cannot Be Ignored - So really what we're doing here is trying to turn information into information that cannot be ignored. If you haven't read or listened to "Good to Great," it's a really great resource that I would suggest to you. Not just for a dashboard, not just for decision-making, but just for management in general. He really does talk a lot about how you have got to get your information into a place where you cannot ignore it. So I suggest that book to you...
Interest in Business Intelligence - Regarding your interest in business intelligence, what do you see as some of the future trends in BI? when you link data and business together, you get to business intelligence. This is why you can afford over 10 years and focus on exclusively the domain of BI. And what about utilities? Are you dealing with analytics and utilities as well...
Look for Spikes in Trend Lines - Could you talk about how the analytics software facilitates the discovery process? You say using visual analysis software, you can facilitate that process, and I understand that, for example, you will connect a data set to an application that you purchase, and you bring in certain columns or certain fields of course and then basically can you run a preview then apply different algorithms and kind of get different visualizations? Do you look for the spikes in the trend lines, or the red areas or the green areas of a heat map...

Need for BI Platforms - You know a lot of the internet things data call logs, you know service records, all those things are being captured in unstructured formats, and there will be more and more demand, and there will be lot more need going forward for BI platforms to provide live connectivity to the sources in order to satisfy users of all skill sets. So oftentimes when we are reading the industry publications, we see the question being asked around, what is the Big Data platform of the future...
Report Exception Alerts and Notification - End users can define alerts and notifications based on individual reports. Trends, thresholds, and time conditions can also be combined to define an alert condition. Distribution lists can be created and maintained. Zero client, end user report viewing interface that only requires a Web browser. End users can interact with reports, utilize searching and exporting, and many other report and visual analysis functions...
Requirements Management Tools - We are starting to see requirements management tools show up an awful lot and often in the cloud based world. What a great idea. I challenge anybody out there if you are not already doing so, to come up with an application on an iPad or a Blackberry Playbook that I could sit down with my customer and draw out a model using nothing but my finger. I'd like to plug it into a projector, and say does it look like this...
Scorecarding Proven Approach - Scorecarding is a proven approach for monitoring, measuring and managing performance by tracking metrics. A scorecard is a list of key performance indicators (KPIs), or metrics, that present current performance data for a business process or strategy against goals, quotas, and target trends. Each target helps monitor the performance of a metric...

Searching For Easy to Use Data Analysis Tools? Tired of sifting through loads of data that take dozens of clicks to get through static reports? Want to have data analysis tools that speed up analysis by condensing static reports into a single interactive, multi-dimensional analytical view? InetSoft offers powerful, yet intuitive data analysis tools that are easy, agile and robust to condense static reports into a single view. A visualization engine enables quick identification of trends and outliers for any business user...
Shrinking Big Data Sets - When many people think or speak about "big data," the assumption is that there exists billions and billions of bytes of useful, meaningful information that you can use to learn more about your business or your customers. In reality, however, for any given observer the amount of "noise" can be overwhelming compared to the amount of truly meaningful data. Getting to this valuable subset requires strategic filtering and effective big data analytics tools, and can be drastically different for every user...
Stronger Analytical Culture - The best performing companies are more likely to report a stronger analytical culture, one that sees value in the timely analysis of relevant data in order to support major decisions as opposed to those that just run largely on gut feel. Also the best run companies are more likely to employ what's frequently referred to as a data scientist, someone dedicated to the data that understands not only how to manage and improve the cleanliness, usability, and accessibility of data, but someone who also understands statistical modeling, and in some cases how to make the data more relevant to business decision makers...
Ten Best Data Visualization Tools - Visualize Free, our easy-to-use visual analysis tool, has been ranked among the ten best data visualization tools by CreativeBloq. There are hundreds of tools out there to help you display your data in a visually appealing way, and we are honored to rank in the top ten. Visualize Free makes spotting trends or irregularities in multi-dimensional data nearly effortless with a drag & drop designer. Our visual analysis tool allows you to present data in a way that will quickly draw attention to your most important findings...

Treat All Data Like Big Data - Rather than waiting for some definitive moment when your databases are bursting at the seams or your bar charts look like a print test page, treat all data as if it were big. Except in the rare event you are avoiding any kind of growth, your business can only benefit by using tools that scale with you as your authority expands. If you have data, you owe it to yourself and your business to utilize that data properly. Find software that can scale with you, and show you the bottom line quickly and easily, in ways that you, your clients...
Unstructured Information Business Intelligence - The next thing that will influence business intelligence is the use of unstructured information. People are going to want to include that in their BI systems. How to implement that one with semantics is a challenge. Another area of future development is automated embedded intelligent solutions which will bring us the right analytics at the right moment of time. The explosive data volumes and the challenges that companies face in trying to manage...
Use Data to Transform - The next way both employees and leaders use data to transform the way their business is Increased Operational Efficiency and Asset Utilization. One major part of analytics made possible with business intelligence is descriptive analytics. Simply explained, descriptive analytics evaluates business data and converts it into something decision makers can understand and base their actions on. Simple examples of descriptive analytics reports are sales, customer, and operations reports...
Variety of the Data - So this is both the opportunity and the challenge, because as we see in the increase in the variety of the data and the amount of data and the new use cases that are coming out, it's the business that knows their question, and it's the business that knows the next question and the data questions and how to find the data questions. So we have to put the data and the analysis in the hands of the business, and I think we all understand that what the implication is...

View Charting Tool Information - Here you will find help topics and product information about InetSoft's free and commercial charting applications: We see a lot of organizations looking at how to automate decisions and actions. Thinking back to the idea of embedding business intelligence in systems, organizations are certainly very much looking at how they can take decisions that are routine or repeated decisions and figure out how they can automate them using software. Lots of these things are tending in the direction...
What Is Data Mashup Definition - Within the data analytics and BI industry, a small number of vendors have been creating applications that allow the combination or mashup of disparate data sources to be improvised without necessarily relying on a IT heavy step of ETL and data warehousing. This is now being referred to as "data mashup." While combining disparate data sources is a common application for a data mashup, note that even in a single data source environment a mashup can be made by combining data from different tables in a way that had not been previously anticipated...
Which Analytic Dashboard Software - StyleBIT is a sophisticated analytic tool for business performance, that provides a different level of interactivity and dashboard appeal. While other vendors offer advanced tools for operational use only, our dashboard software provides easy access and employment to any and all users with unique and intuitive data mashup capabilities. This allows users to combine disparate data from a multitude of featured databases...
Who Makes the Best Dashboard Creator - InetSoft's dashboard creator is flexible; it offers a simple drag-and-drop interface for less technically inclined users as well as complex scripting capabilities for IT and programmers. Because of this malleability, the tool's applications can be quite varied. StyleBI, InetSoft's all-encompassing business intelligence suite, gives every day uses the power to create highly interactive viewsheets with little to no knowledge of the code that makes them tick. The system uses a series of charts, gauges, selection boxes, and various other elements to create professional monitoring tools in minutes...