Why an Environmental Testing Company Switched from Sisense to InetSoft for Business Analytics Reporting
Environmental testing and compliance services operate in a world where data is not just important, it is regulatory evidence. Every water sample, air quality reading, soil test, and material analysis must be traceable, accurate, and delivered on time. For one mid-sized environmental testing company serving manufacturers, municipalities, and construction firms, the pressure to modernize reporting and analytics had been building for years.
The company initially chose Sisense as its business analytics reporting platform, hoping to centralize lab data, field service metrics, and compliance reporting. While the platform delivered some early wins, the cracks began to show as the business grew, regulations tightened, and clients demanded more transparency. Eventually, the organization made the decision to migrate from Sisense to InetSoft. The reasons behind that move reveal a lot about what environmental testing companies truly need from their analytics tools.
The Business Context: Data-Heavy, Time-Sensitive, Highly Regulated
This company operates multiple labs and field teams across several states. Technicians collect samples on-site, labs process those samples, and compliance reports are delivered to clients and regulators under strict deadlines. Each test generates dozens of data points: concentration levels, thresholds, pass/fail flags, site identifiers, timestamps, and chain-of-custody details.
Leadership wanted a single analytics platform that could:
- Provide real-time visibility into sample status and lab backlog
- Track compliance pass/fail rates by client, region, and test type
- Monitor technician productivity and on-time sample collection
- Support client-facing dashboards for key accounts
- Reduce manual reporting effort for regulatory submissions

Sisense was selected to meet these needs, but over time, several limitations became impossible to ignore.
Where Sisense Fell Short
At first, Sisense seemed like a strong fit: it offered embedded analytics, dashboarding, and the ability to connect to multiple data sources. However, as the company’s data model became more complex, the team ran into challenges that slowed adoption and limited impact.
1. Complex Data Modeling for Lab and Field Data
Environmental testing data is inherently relational: samples belong to projects, projects belong to clients, tests belong to methods, and each result must be tied to a specific site and regulatory standard. Modeling this in Sisense required significant custom work and ongoing maintenance. Small changes to the schema often broke dashboards or required time-consuming rework.
2. Limited Flexibility for Operational and Compliance Views
The company needed both operational dashboards (lab throughput, technician routes, sample turnaround time) and compliance-oriented scorecards (pass/fail rates, recurring violations, regulatory thresholds). Building these different perspectives in Sisense often meant duplicating logic or creating separate data models, which increased complexity and risk.
3. Performance Issues at Scale
As historical data accumulated, some Sisense dashboards became slow, especially those combining lab results, field activity, and client-level rollups. Analysts resorted to extracts and workarounds, undermining the goal of a single, live source of truth.
4. Limited Self-Service for Non-Technical Users
Operations managers and lab supervisors wanted to explore data, filter by site or client, and build simple views without relying on the BI team. In practice, many found Sisense too rigid or complex for everyday self-service, which led to a resurgence of spreadsheets and manual reports.

Why the Company Chose InetSoft
After a review of alternatives, the company selected InetSoft as its new business analytics reporting solution. The decision was driven by several key capabilities that aligned closely with the realities of environmental testing and compliance.
1. Flexible Data Integration for Lab, Field, and ERP Systems
InetSoft’s ability to connect to LIMS (Laboratory Information Management Systems), field service tools, ERP, and CRM systems without rigid modeling upfront was a major advantage. The company could blend sample data, technician routes, client contracts, and billing information into unified views without rebuilding everything from scratch each time the schema evolved.
2. Semantic Layer and Governed Metrics
With InetSoft, the team defined a semantic layer that standardized key metrics such as turnaround time, on-time collection rate, compliance pass rate, and lab throughput. This ensured that operations, sales, and compliance teams all worked from the same definitions, reducing disputes over “whose numbers are correct.”
3. Performance and Scalability for Historical and Real-Time Data
InetSoft handled both historical trend analysis and near real-time operational dashboards more efficiently. Lab managers could see today’s backlog and sample status, while executives could review multi-year trends in violations, client growth, and test volume without waiting for slow queries.
4. True Self-Service for Operational Users
One of the biggest wins was the usability of InetSoft for non-technical staff. Lab supervisors could filter dashboards by site, test type, or client, create their own saved views, and export regulatory-ready summaries without involving the BI team. Field managers could monitor technician coverage and route efficiency directly from their own dashboards.

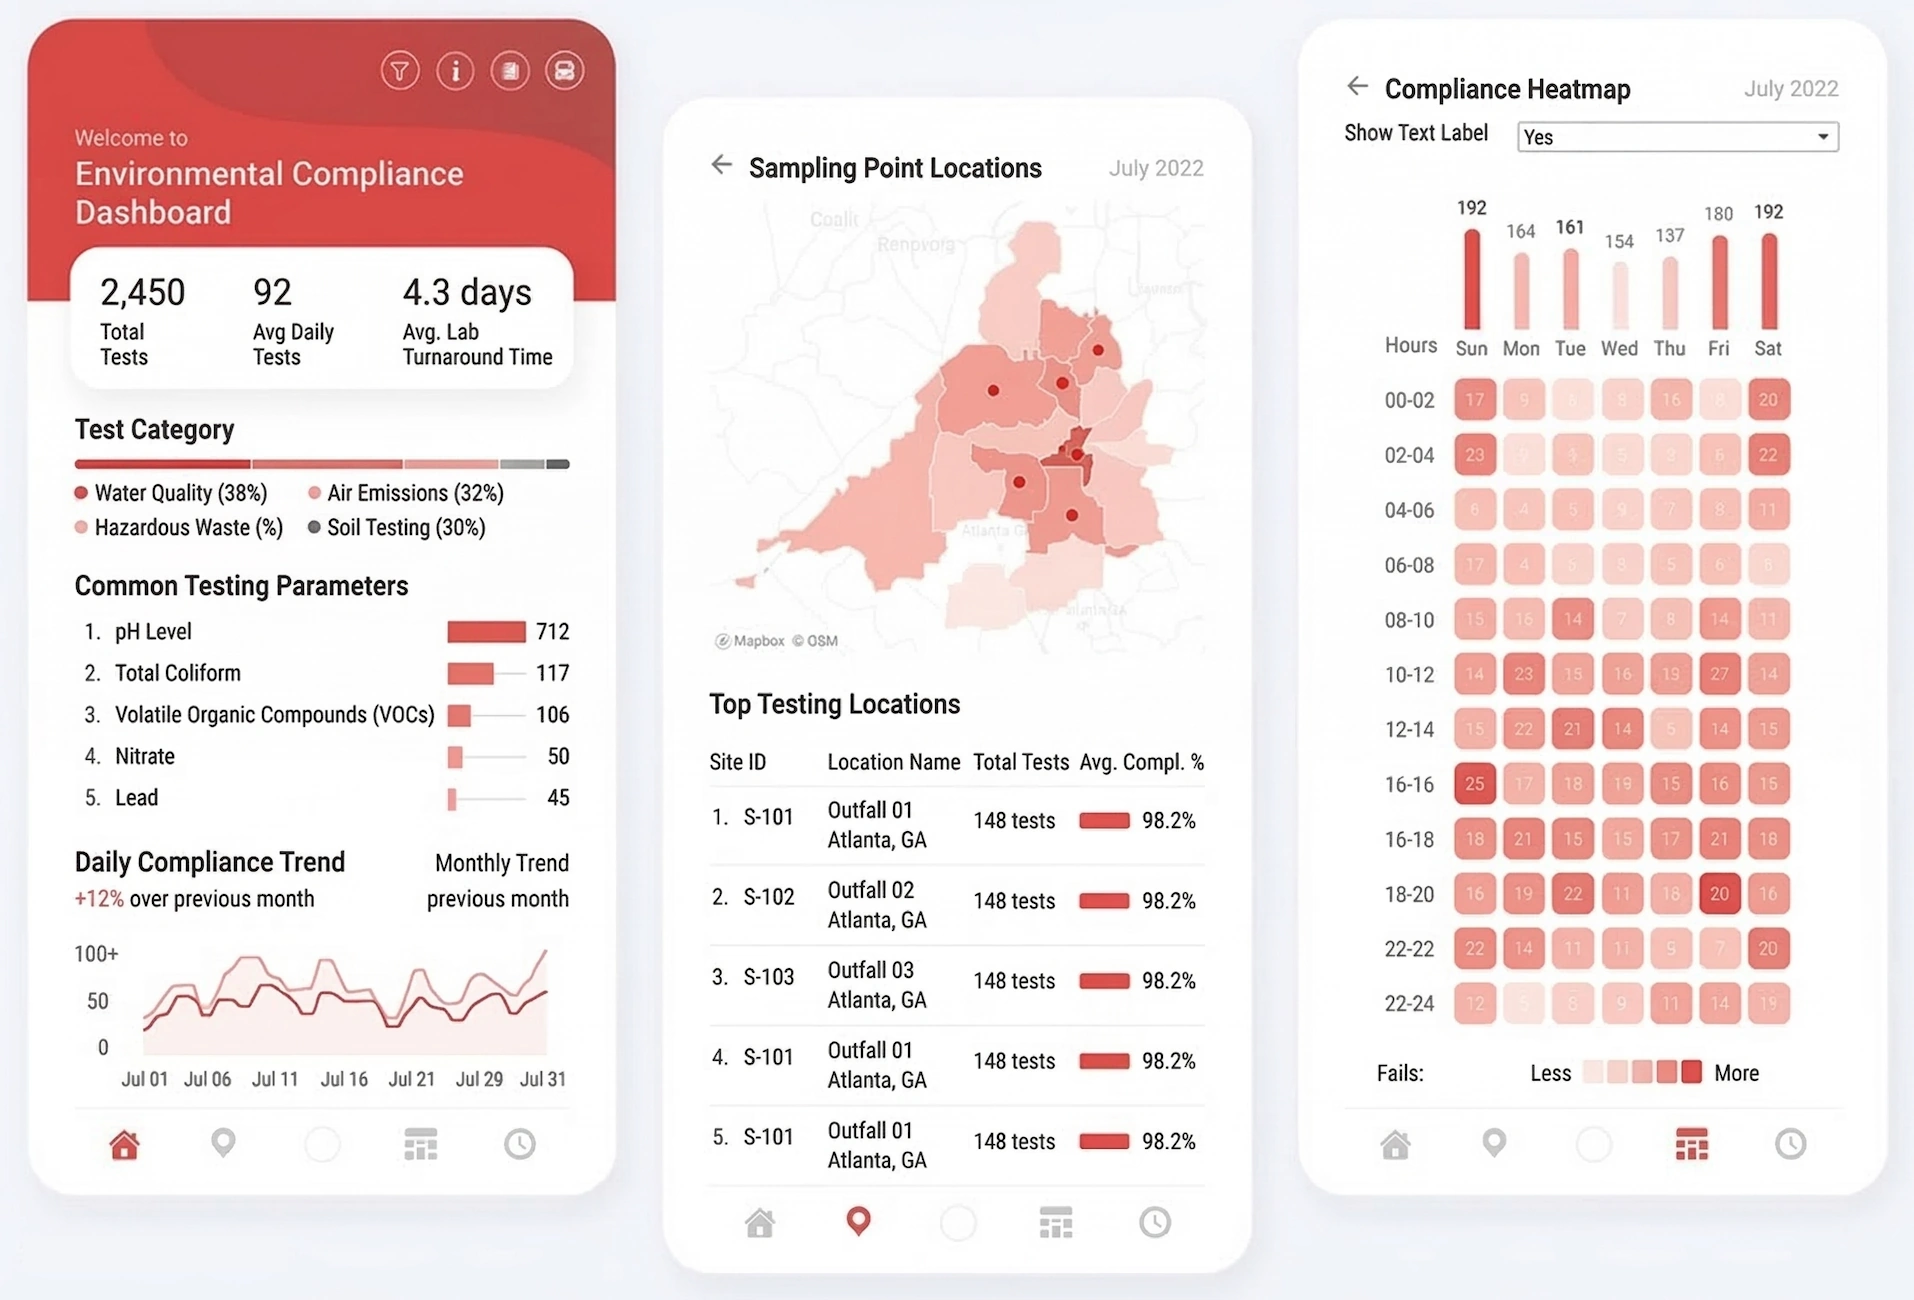
New Dashboards That Changed the Conversation
After migrating to InetSoft, the company redesigned its core dashboards around real operational questions rather than just data availability.
- Sample Lifecycle Dashboard: Tracks samples from collection to lab receipt to result approval, highlighting bottlenecks and overdue items.
- Compliance Risk Dashboard: Shows pass/fail rates by site, recurring violations, and clients at risk of non-compliance.
- Lab Operations Dashboard: Monitors daily throughput, backlog, instrument utilization, and staff workload.
- Field Service Dashboard: Visualizes technician routes, on-time collection rates, and missed or rescheduled visits.
- Client Performance Dashboard: Provides key accounts with transparent views of their test volume, compliance trends, and turnaround times.
These dashboards were not only faster and more reliable than their Sisense predecessors, they were also easier to adapt as regulations changed or new services were introduced.
The Business Impact of Switching to InetSoft
Within the first year of using InetSoft, the environmental testing company reported several tangible improvements:
- Reduced manual reporting time for regulatory submissions and client reports
- Improved on-time sample turnaround due to better visibility into lab bottlenecks
- Fewer internal disputes over metrics, thanks to governed definitions
- Higher adoption of dashboards by lab and field managers
- Stronger client relationships supported by transparent, data-rich reporting
Most importantly, leadership felt that analytics had finally become a strategic asset rather than a technical burden. Instead of wrestling with the tool, teams could focus on improving environmental outcomes, reducing compliance risk, and growing the business.
For environmental testing and compliance service providers, the choice of analytics platform is not just a technology decision. It directly affects how well they manage risk, serve clients, and respond to regulatory change. For this company, moving from Sisense to InetSoft was the turning point that made performance management, compliance reporting, and client transparency work together in a single, coherent system.

More Information
Ad Hoc Report Software - Looking to design or modify interactive reports yourself, without outside help? The ability to transform data into charts and tables for easier analysis is something that more business users are looking to take into their own hands. Perhaps you've tried to work with experts and had difficulty communicating exactly what you were looking for in your reports. There's a solution for independently creating the reports that you want, one that requires only a small amount of learning...

Administering Archived Reports - Administering archived reports is simple with InetSoft's reporting software, an intuitive reporting solution that is used as a stand alone or embedded solution at enterprises worldwide. Administrators can manage the reports and the trashcan through the Enterprise Manager. A report can be saved into the archive through a scheduled task or by a user through their Portal page, using the 'Save as archive' option in the 'Save As' dialog box. If a file system archive is being used, archiving a report with the same name as an existing archived report will cause the original archived report to be overwritten by the new archived report. If a 'CVS' archive is being used, saving a report to an existing report adds a new version to the archive, rather than replacing the previous version. The versions are stored until removed explicitly by the user, or according to the version archive rule. If a user has at least read permission in an archived report, the archived report shows up on the repository tree on the user's Portal page. A user can then click on the archived report name to view the report...
Advanced Enterprise Reporting Topics - Some of the advanced features discussed in this section are available only in the Enterprise products: Style Report Enterprise and StyleBI. A form is a collection of fields, which can be used to collect user input. The replet architecture allows user actions to be handled by server side Java objects. Since fields are grouped into a form using the form name, they do not need to be consecutive in the element flow. In fact, text elements are frequently added next to field elements in order to add labels to each field. In the Web Viewer, form elements cannot be global across forms. This is to maintain compatibility between Netscape Navigator and Microsoft Internet Explorer. To access the form controls (if they are not visible), click on the small rightarrow in the element toolbar on the left of the Report Designer. Each form consists of one or more fields. Fields are on-screen controls which can be used by end users to interact with the report. All field elements are float elements. This means they share the layout properties of float elements, and can be positioned using an anchor. Every field element has a ‘Form Name’ attribute. The ‘Form Name’ is used to group fields into one form. All elements sharing the same ‘Form Name’ belong to the same form. They are packaged into a RepletRequest object to be forwarded to the server...
Ads Reporting Software for Facebook - Looking for a good solution for Facebook reporting? InetSoft's pioneering BI application produces great-looking dashboards that mashup social media data with other marketing data in your organization. View a demo and try interactive examples...
Agile Reporting Tools - Good morning and welcome to our webinar on agile reporting tools and agile BI. My name’s Abhishek Gupta, and I am with InetSoft. InetSoft is a pioneering provider of business intelligence and data discovery software. Before we begin though I'd like to go over a few quick housekeeping items and questions that we normally get during this webinar, if you have any questions, feel free to ask them anytime, you can type them in the chat panel in the lower right hand corner of GoToMeeting, and uwe will make sure we respond to you. If not live, we’ll make we follow up through an e-mail response after the webinar. Also we have a Twitter feed that we’re monitoring, it's #agilebi. After the webinar these slides and the recording of the webinar will be available for download. You can also e-mail us directly at info@inetsoft.com. So with those house keepings items out of the way we’ll just jump into the webinar. So as we’ve seen in our industry, and I am sure most of you have seen this as well, the topic of Agile Business Intelligence has gained a lot of momentum lately, and I am sure you are all aware of this as we are, and I am sure you are also aware of the many benefits involved with adopting an Agile BI strategy. With that said there still seems to be lot of ambiguity in the market placed on certain elements surrounding the topic of Agile BI...

Agribusiness Software Reporting Solution - AgKnowledge is an industry leading, cloud based Agribusiness SaaS solution for medium and small fresh fruit and vegetable producers and distributers, originally created by TechKnowledge Associates, Inc., an industry leading supplier of Agribusiness software and services to medium and small fresh fruit and vegetable producers and distributors...
Airtable Reporting Tool - Looking for a good solution for Airtable dashboard reporting? InetSoft's pioneering BI application produces great-looking cloud-based dashboards with an easy-to-use drag-and-drop designer. View a demo and try interactive examples...
Alternative to Excel Charts - When searching for a visual alternative to Excel charts, a project manager is going to inevitably end up researching premium BI software. That's because Excel reporting styles are limited, the visualizations are primitive, and analysis is tedious. With Excel getting results is slow as managers and decisions makers need to revisualize entire data sets for every nuance and new data question. This makes the trip from statistical data to actionable information cumbersome, and effectively eliminates a business's ability to deal with real time changes to real world conditions. Over the long term a business is hamstrung by Excel, decision makers can't manage efficiently making next week's decisions based on reports from last week's data...
Alternative to Splunk Reporting Tools - Searching for a Splunk reporting tools alternative? InetSoft's advanced flexible BI application makes a good option. Get paginated reporting, interactive dashboards, and a data mashup engine from a pioneer in self-service BI since 1996. View a demo and try interactive examples...

Amazon Reporting Tool - Looking for an Amazon reporting tool? InetSoft's reporting application runs in AWS and offers maximum self-service. Highly rated for customer service and ease of deployment, InetSoft has been a pioneer in self-service BI since 1996. View a demo and try interactive examples...
Analytics Reports Generation - Looking for good software for generating analytics report? InetSoft's pioneering dashboard reporting application produces great-looking web-based reports with an easy-to-use drag-and-drop designer. View a demo and try interactive examples...
Analytical Dashboards - The best way to grow your business and keep growth strong is by thoroughly tracking your various operations, and analyzing the results. This means storing and compiling data and producing readable graphs and charts in a format that conveys meaningful patterns. An analytical dashboard visualizes metrics in a clear intuitive way, and even contains statistical calculations which prescribe...

Any Good Reporting Tool for MongoDB? Looking for a good MongoDB reporting tool? InetSoft's pioneering dashboard reporting application produces great-looking web-based reports and dashboards with an easy-to-use drag-and-drop designer. View a demo and try interactive examples...
Apache Derby Reporting Tool - Looking for a good solution for Apache Derby dashboard reporting, such as for your online transaction processing? InetSoft's pioneering BI application produces great-looking cloud-based dashboards with an easy-to-use drag-and-drop designer. It complements Derby well, as it is also a small footprint Java-based application. View a demo and try interactive examples...
API for Web Reporting - The InetSoft web API provides a RESTful interface for administering an InetSoft application server and accessing assets on that server. Some of the more common commands follow: Authentication is performed using the /api/public/login endpoint. The returned token must be passed to all subsequent API calls in the X-Inetsoft-Api-Token HTTP header. GET /api/public/login Used to perform single sign-on (SSO) authentication. Any headers or cookies required by the SSO implementation are the responsibility of the caller. POST /api/public/login Used to perform standard authentication with a username and password. POST /api/public/logout Used to log out of the current session. GET /api/public/dataSources/{id} Gets the full properties of a data source...
Appfigures Reporting Tool - Looking for a good solution for Appfigures dashboard reporting? Mashup your mobile app data with other enterprise data for a wider view of performance. InetSoft's pioneering BI application produces great-looking cloud-based dashboards with an easy-to-use drag-and-drop designer. View a demo and try interactive examples...
Application for Snowflake Reporting - Looking for Snowflake reporting applications? InetSoft is a pioneer in self-service reporting and can mashup data in Snowflake with almost any other data source. View a demo and try interactive examples...

Application Tracking Reporting Tool for New Relic - Looking for a good solution for New Relic dashboard reporting? Mashup your mobile app data with other enterprise data for a wider view of performance. InetSoft's pioneering BI application produces great-looking cloud-based dashboards with an easy-to-use drag-and-drop designer. View a demo and try interactive examples...
Archive Report Options - InetSoft's reporting software comes with extensive archive report options that are simple to incorporate in a matter of minutes. The following options are available for archived report on the 'Archive' page. The archive has the option 'Delete Removed Report Permanently'. If this option is chosen, then when a report is deleted, it is not placed in the trashcan but is permanently deleted from the system. The 'Archive Indexing' option is by default set to 'true'. When this option has been enabled, a report saved in the archive will be indexed for search capabilities. When this flag is set to 'false' the archive search will be disabled. The 'Traversal Depth' option allows you to set the number of levels of reports that can be followed starting from the hyperlinks within the archived report. This option only applies to the 'Generated Report' output format. A 'Traversal Depth' of 0 indicates that the reports targeted by hyperlinks in the archived report will not themselves be archived, and the hyperlinks will therefore not be active. A 'Traversal Depth' of 1 indicates that one level of hyperlinked reports will also be archived, which then allows the user to follow hyperlinks in the original archived report down to a second level of archived reports. However, the hyperlinks (if any) in that second level of archived reports will not themselves be active, unless an even higher traversal depth is specified...
AskNicely Reporting Software - Looking to create customer service dashboards that pull in your AskNicely data in real-time? AskNicely is a cloud-based online survey software that helps businesses create surveys and collect feedback in real time based on Net Promoter Score. InetSoft's flagship premium buisiness intelligence software comes with a custom data connector for AskNicely as well as a host of other cloud based and on premise sources. StyleBI was designed to help you integrate any kind of data into your dashboards and reporets...
AskNicely Reporting Tool - Looking for a good solution for AskNicely reporting? InetSoft's pioneering BI application produces great-looking dashboards that mashup net promoter score data with other data sources in your organization. View a demo and try interactive examples...

ASP.NET Ad Hoc Reporting - A professional authoring tool combines word-processing grade architecture with active data manipulation. Key benefits include the ability to: Convey professional, high fidelity presentations Transform and manage raw data Embed business logic with scripting Enhance manageability and dexterity StyleBI can deliver on-demand reports on the Web. In-report exploration capabilities empower business users with the ability to reshape information in real time. Key benefits includes the ability to: Compile up-to-the-minute information Adjust reports in real time Minimize performance bottlenecks InetSoft’s AJAX and Flash powered Web 2.0 technology brings a desktop-grade Web user experience to ad hoc query and reporting. Key benefits are the ability to: Furnish professionally designed reports Gather information by self-service queries Produce presentation quality reports on the Web...
ASP.NET Reporting Tools - InetSoft's StyleBI software is unique. As a 100% Web-based application, StyleBI offers users rapid implementation and low maintenance overhead. Zero-client deployment requires only a Web browser. A powerful patent-pending technology called Data Block™ enables great self-service, adaptability, and overall efficacy via real-time data mashup and re-usable data access queries. Input and control elements such as range slides and selection lists maximize interactivity. StyleBI offers users the ability to serve data needs in a single compact, multi-paneled dashboard that otherwise would have required paging through dozens of static reports based on older technologies...
Asset Management Reporting Software - Every company and organization has assets to keep track of. Having a good business intelligence system implemented is imperative for a business to succeed long-term. However, simultaneously analyzing and tracking valuation data can quickly prove overwhelming...
Association Reporting Tool - Looking for good reporting tools for associations? InetSoft's pioneering BI application produces great-looking dashboards for analyzing membership trends and dues payment performance. View a demo and try interactive examples...
Auditing Report Asset Dependencies - InetSoft's reporting software provides multiple tools to gauge and improve performance. Users can audit report asset dependencies and allocate resources accordingly. You can produce an audit report for asset dependencies. Asset dependency information describes, for each asset, the other assets which it itself requires, and the assets which require it. The audited assets include every reporting unit, not only worksheets and Viewsheets. The schedule on which the dependency report is generated can be configured from the 'Repository' > 'Asset Dependency' node under the Server tab, which opens the 'Asset Dependency Configuration' page. A database must first be specified in the 'Configuration' > 'Database' age under the Server tab. To configure a regular asset dependency audit, follow these steps: 1. Enter a time in the 'Check asset dependencies at' field. 2. Press the 'Create Schema' button, and press 'Apply.' A schema needs to created in cases where the database has been changed from the default database (under 'Configuration' > 'Database' in the Server tab). 3. To delete the schema, click the 'Delete Schema' button, and press 'Apply.' The asset dependency audit can also be run on demand from the 'Scheduled Tasks' node under the Server tab. Select the __check assets dependency__ task from the task list, and press the 'Run Now' button...
Automate and Create Reporting Documents - Looking for good reporting document creation software. InetSoft's pioneering dashboard reporting application produces great-looking web-based reports with an easy-to-use drag-and-drop designer. View a demo and try interactive examples...
Automated Online Reporting Program - Looking for a good continuous online reporting program? InetSoft is a pioneer in offering flexible, enterprise-grade reporting software. Use an easy-to-use drag-and-drop designer to create great-looking web-based dashboards and reports. View a demo and try interactive examples...
Automated Reporting System for Enterprises - Designing and modifying reports for every different departmental need of an enterprise can become a daunting and ineffective approach. What is more frustrating for data scientists is having to start over again when the end users informational needs are not met. InetSoft's automated reporting system has simplified users' abilities to run queries, prints reports, and download all the information needed to manage costs and build customs compliance audit trails...
Automated Reporting Tools - Gathering and analyzing data by hand can become a daunting and ineffective approach in creating reports for your organization. What's more frustrating is doing all the work to get results that doesn't satisfy your needs. Traditional BI methods, although useful, can sometimes feel outdated and slow. In some cases, it can have adverse effects on your organizational goals. At InetSoft, we've transcended those conventional methods with our innovative automated reporting tool, Style Report...
Automated RPA Reporting Tools - Robotic process automation (RPA) is currently one of the most rapidly expanding technologies that help organizations address the issue of automating routine operational activities. Because the number of organizations that have embraced RPA as a tool for enhancing efficiency and decreasing expenses is rising, RPA development services have become popular. Although, an RPA implementation can be scaled, this becomes less easy the moment one tries to expand the process. When several bots performing assorted tasks within the organization create vast quantities of data, it becomes challenging to monitor and analyse manually. This is where advanced analytics dashboards and reporting automation becomes significant...
Automated Scheduled Report Distribution - We have shown an example of writing a report from scratch, inserting a pivot table and a chart. We have seen sample reports where you can automatically refresh the data and filter the data. And lastly, wouldn’t it be great if there were a handful of reports that you simply wanted to run on a weekly basis or a daily basis and have them automatically run and either emailed to you or printed or saved? Well, you can do that, too, with automated scheduled report distribution. Within the business intelligence suite, in addition to the query and analysis tools, there’s also a report scheduling tool. So let’s say you want to create a handful of reports to run every Friday. How would you do that? You simple click on the add task button at the top. Give it a name. We’ll call it Friday reports. Come down to the right, and click the little plus, and this is where it’s going to say what format do you want to send it in? Your choices are an Excel workbook, PDF, Word doc, rtf, or PowerPoint. Other functions can be added into this list of things that need to be done. By choosing Excel workbook, it allows you to go out and pick the report you’d like to run, or reports. Hit ok, and once you’ve got this, you can then decide what you want to do. You can see a variety of tabs across the top. You can print this to your local printers. Maybe you want to print selected sheets. You can do that as well...