Dashboard Building Resources
Are you looking for resources and tools to learn about and start building dashboards? InetSoft offers free software and articles. Click the orange Start Free button to choose one of our free online offerings and scan through our articles below to learn about industry and department uses of dashboards. Get inspiration for your dashboard from our gallery.
Real Estate Agents Rely on Dashboards - Though real estate agents serve under a broker, their day-to-day work - i.e., networking, generating leads, working with clients - is carried out independently. When you take on this role, you're not only working as an agent but as a one-person digital marketing team. Your ability to earn a commission hinges on how well you adapt to the roles of content creator, marketer, sales representative, and adviser to your clients. To thrive in the real estate industry long-term, you have to get really good at managing each of these roles simultaneously and tracking your growth year-over-year. This is where using a dashboard works to your advantage. A dashboard is a data hub that takes all of your important analytics and presents them in the form of graphs, tables, and charts. This allows you to keep the wide view - we're talking big picture growth - even as you work one-on-one with your clients in the here and now...
Real Estate Companies Use Dashboards - No matter which segment of real estate you are in, you must be using KPIs to track your performance. If you have not used any KPI so far, you are making a grave error because you can't measure your progress without them. Like many other sectors, real estate also requires a strong relationship with customers. Therefore, making sure that the business goals are met on time and performance is up to the mark is essential. Even if you work day and night, you can miss some minute details, which KPIs do not. So, let us see why successful real estate companies use dashboards. With the use of the right KPI dashboards, we can figure out multiple things for growth and expansion. We also discover many hidden trends and gain knowledge of factors that routine reports fail to explain. In this way, we get a complete business overview at a glance. In comparison, analyzing the business reports and comprehending the results requires time, effort, and technical knowledge. Furthermore, making huge business data available to all employees is difficult. But, business dashboards make it possible. Here, all kind of data is available at one glance. Therefore, the management of the real estate business uses it smartly. For instance, real estate finance teams can figure out the high commission properties for calculating the projected net sales for the coming month. Additionally, many real estate agencies rely heavily on dashboards for decision-making. They do not believe in instincts and personal judgments. Instead, they believe in numerical figures gathered through dashboards. For instance, dashboards help in evaluating employee performance. This helps in making the future decisions of hiring or firing employees...
Real Time Dashboard - InetSoft provides a powerful application for creating real time dashboards that can meet the demands of even the most sophisticated consumers. With the ability to pull in fresh data from all sources every time the dashboard is refreshed or loaded, business users can always have the most up to date information, without any time lag or manual update process. InetSoft has combined high-performance data accessibility with the ability to easily generate visualizations and reports, so business owners can analyze data in new ways without needing help from IT. Whether your preference is paginated reports or interactive charts and visualizations, they will all load with the most up to date data - either at the click of a button or automatically, at specified time intervals...
Real Time Dashboard Building - Are you looking for a good tool to build real time dashboards? InetSoft's pioneering BI application produces great-looking web-based dashboards with an easy-to-use drag-and-drop designer. Get cloud-flexibility for your deployment. Minimize costs with a small-footprint solution. Maximize self-service for all types of users. No dedicated BI developer required. View a demo and try interactive examples...
Real Time Dashboard Reporting - InetSoft has been able to make BI even more efficient with the addition of real-time dashboard reporting. Using InetSoft’s intuitive interface, users are able to create pixel-perfect visualizations and dashboards that not only meet the current needs of any business, but can also adapt to changing needs at any time. InetSoft utilizes techniques such as caching, materialized views, and pre-aggregation in order to access even the biggest sets of data in real time. This technology has combined high-performance data accessibility with the ability to easily generate visualizations and reports so business owners can analyze data in a new way without needing advanced IT experience...

Real-Time Data Dashboard Solution for Businesses - Looking for a real-time data dashboard solution? Since 1996 InetSoft has been making business dashboard software that is easy to deploy and use...
Reasons Assisted Living Companies Use Dashboards - Are you a manager of an assisted living community in charge of operations? Find out how senior care operations managers track the most up-to-date company information on one screen. Assisted living companies and physical therapy businesses rely on dashboards to gain crucial insights into the performance of their businesses. They compete in a large industry, and so it's important for both kinds of companies to have performance dashboards to add more value to everyday tasks. History of Dashboards Dashboard are common features in almost all apps, including Google Analytics. It is an essential tool for business and website owners who want to track the performance of their sites and users. Google first made it available for administrators to use in their website analytics tool on the 13th of July, 2007. The history of this can be traced back to when it was known as Urchin Web Analytics, which was a freeware program that became available for download on 10th of February, 2000. It was developed by Josh Williams and Matt Cutts...
Reasons Credit Union Managers Use Dashboards - Credit union managers have a variety of tasks that are part of their job description. Some of those tasks include financial reporting, training, and onboarding staff, as well as marketing and sales. Everything they do has to be data-driven and even their marketing and sales approach should include data-backed storytelling. The vast majority of the data needed by credit union managers was handled using Excel sheets and other traditional software. Lately, this has changed and a lot of managers started focusing on using dashboards. What was behind this change of heart? Here are the reasons...
Reasons to Evaluate InetSoft's Dashboard Software - InetSoft’s dashboard software, including the flagship StyleBI platform, is designed for organizations looking to deliver dynamic, scalable, and interactive business intelligence. Whether you’re a small enterprise looking for self-service dashboards or a large organization integrating multiple data sources, InetSoft offers a flexible and modern solution. Here are the top ten reasons why your team should consider evaluating InetSoft's dashboard software: 1. Lightweight and Serverless Deployment InetSoft’s StyleBI is a serverless, microservice-based architecture that requires minimal IT infrastructure. This makes it a great fit for organizations that want to deploy powerful dashboards without investing in large-scale server setups or third-party hosting. It can run in the cloud, on-premise, or embedded within other platforms...
Reasons Fund Raisers Use Dashboards - Organizing a fundraiser can be a daunting task in our day and age. It seems that the world economy has not fully recovered from the pandemic and politics don't make the state of things any better. Obviously, all of this means that people are not as likely to give away their money because they might not even have any money to give away. That being said, this doesn't mean that you shouldn't organize a fundraiser if you really need one. You just need to find tools that will help you achieve your fundraising goals, for instance, a dashboard. Here are the ten most important reasons why fundraisers need to use dashboards for their projects...

Reasons Restaurant Managers Use Dashboards - The management dashboard shows the crucial data expected to deal with an association in a single place. The dashboard mainly lists the objects, important actions, projects and items that need action. A restaurant manager can use a preferred dashboard vendor to help him or her get the right information consistently. Restaurants are busy and have different sales points. There is the sale of food, drinks, bed, laundry, pool and so on. The restaurant manager can have a hard time keeping track of all the sales performed by each department. The solution to this is the use of a sales dashboard that visually represents all the restaurant's sales information. The sales information is stored in the dashboard and can be retrieved anytime when there is a need...
Reasons Telecom Managers Use Dashboards - As the industry that pioneered the gathering and analysis of data, data intelligence is still very essential to the telecom industry. There's no doubt that the backbone of the ICT age is the telecom industry. With the vast and ever-increasing amounts of data passing through their networks every day, they must ensure the safety of this data and the efficiency of their critical assets through data intelligence. Data visualization is crucial for managers of telecom companies. They have to deal with a lot of data at the same time, and the only way to handle that efficiently is to be able to visualize it. Telecom companies generate a lot more data than many other companies and industries. Managing this extensive data might result in problems for the managers and staff if they cannot handle it properly. Scheming, through hundreds of documents, will only create a backload of work and stress everyone. So, using a dashboard is a necessity for them. In economic terms, it is a need, not a want...

Recommended Alternative for Salesforce Dashboard Reports - Looking for a good solution for Salesforce dashboard reporting? InetSoft's pioneering BI application produces great-looking dashboards that give you more self-service analytic capabilities. View a demo and try interactive examples...
Recruiter Dashboards and Their KPIs - Collection and analysis of data are the foundation of process optimization and recruiting is not an exception. This is where recruiting dashboards come in handy. They allow for the collection and comprehensive data presentation so that professionals could get valuable insights into all processes. Together with Jooble, we've prepared an ultimate guide to the most important KPIs to track in the recruiting process. You'll also learn how to collect and interpret such data as job board information, applicant-to-hire ratio, or retention rate. A recruitment dashboard is a visual collection and representation of various metrics and key performance indicators (KPIs). It also usually features reports on different aspects of the recruiting funnel and its efficiency. Such dashboards might include all types of data that have to do with recruiting, from budgets to candidates' information...
Recruiter Dashboard Metrics - A recruitment dashboard shows you how your recruitment funnel is doing through a visual compilation of data-driven analytics, reports, as well as key performance indicators (KPIs). Budget, campaigns, hires, and applications are all part of this data. Your company will be able to enhance sourcing to locate the best applicants for the roles you are hiring for, create innovative tactics and strategies, and lower recruitment expenses with the use of these analytics. Read on to learn which key metrics to visualize on a recruiting dashboard. Finding important indicators for recruiting and selection that can be used to gauge the effectiveness of the hiring process can be difficult for human resources professionals. The only way to enhance and optimize these internal processes, though, is through automation. Even a basic analysis can generate suggestions for enhancement to produce immediate effects. For instance, shortening the hiring process can improve financial results since the business loses money each day a position is open...

Recurly Dashboard Application - Looking for a good dashboard application for Recurly? InetSoft's pioneering dashboard platform can mashup your subscription billing data with other enterprise sources. Make great-looking cloud-based dashboards with an easy-to-use drag-and-drop designer. View a demo and try interactive examples...
Relation Management Dashboard Solution for SugarCRM - Are you looking for a good choice for a SugarCRM dashboard solution? InetSoft's pioneering dashboard reporting application produces great-looking web-based dashboards with an easy-to-use drag-and-drop designer. Get cloud-flexibility for your deployment. Minimize costs with a small-footprint solution. Maximize self-service for all types of users. No dedicated BI developer required. View a demo and try interactive examples...
Report Generator Software Report generator software allows for a clean and consistent availability of data without the headache of having to make the actual report by hand. InetSoft Technology, for instance, provides an excellent interactive report generating software for businesses and organizations and enables the flexible transformation of data, client-customizable reports, and interactive dashboards through its' powerful report design...
Reporting Services Dashboard Examples - Organizations want the ability to display data in a standardized format that's easy to read and supports decision making. They also want to the ability to access all that data from a variety of locations, applications, and devices. InetSoft offers a full-featured business intelligence solution for all your reporting needs...
Reputation Management Dashboard Analytics and KPIs - The success or failure of a company may be influenced by public perception thanks to the influence of social media and internet platforms. In order to track and improve how a company is seen, reputation management has become an essential activity. Key Performance Indicators (KPIs), measures that provide light on the state of a company's reputation, are essential to successful reputation management. This article discusses reputation management dashboard KPIs and how firms assess, track, and react to their online image. An important KPI in reputation management is online sentiment analysis. It entails keeping an eye on internet reviews, news stories, and social media to gauge if a brand is being linked with good, negative, or neutral opinion. Businesses may react quickly to negative sentiment and magnify positive feedback by using this KPI to identify the general tone of talks about their goods or services...
Resource Planning Dashboard - Resource planning is an invaluable task that is a requisite undertaking in all industries. InetSoft's StyleBI makes resource planning far easier than in the past with interactive dashboards, embeddable reports, and a small Java footprint. You can apply conditional formatting to table columns, images, text elements, crosstab tables, and charts, so that the element formatting changes based on the data bound to the element. These conditional formats are called highlights. They are very useful for calling attention to an element when its associated data meets (or fails to meet) some specified condition. To apply a highlight to a table column, image, text element, chart, or crosstab table, follow these steps: 1. Right-click the element, and select ‘Highlight’ from the context menu. This opens the ‘Highlight’ dialog box. 2. Click the ‘Add’ button. This opens the ‘Name’ dialog box. 3. Enter a name for this highlight, and click ‘OK’ to close the dialog box. 4. Repeat the previous steps to enter any additional highlights, and then follow the steps below for each highlight. 5. Select the highlight in the list that you want to edit. 6. In the ‘Properties’ panel, select the highlight format. This formatting is applied when the data meets the highlight condition (specified below). 7. Click the ‘Edit’ button below the ‘Conditions’ box. This opens the ‘Conditions’ dialog box....
REST API Dashboarding Solution - Looking for a dashboarding platform that connects to a REST API? InetSoft's pioneering dashboard reporting application does and enables secure interactive dashboards and analytics. View a demo and try interactive examples...
REST API Reporting Solution - Looking for a reporting platform that connects to a REST API? InetSoft's pioneering dashboard reporting application does and enables secure interactive reports and analytics. View a demo and try interactive examples...

Retailer Location Mapping Dashboard - The Retailer Location Mapping Dashboard below is an example of one of InetSoft's interactive web-based applications for multiple location retailers, like Wal-Mart. This particular chart allows users to monitor and research store locations by geography and year opened. With a point and click environment, retailers can drill down into the details they need for an accurate analysis on one unified screen...
Retail Store Dashboard - Facing the rapid development of the big data era, especially with the increased frequency of online shopping - numerous types of sales data can be collected. To succeed in todays modern retail industry requires modern solutions for modern problems and constant optimization. Today's data-driven industry heavily relies on data analytics to aggregate and track various KPIs. Retailers are turning to data visualization and interactive dashboards to stay competitive...
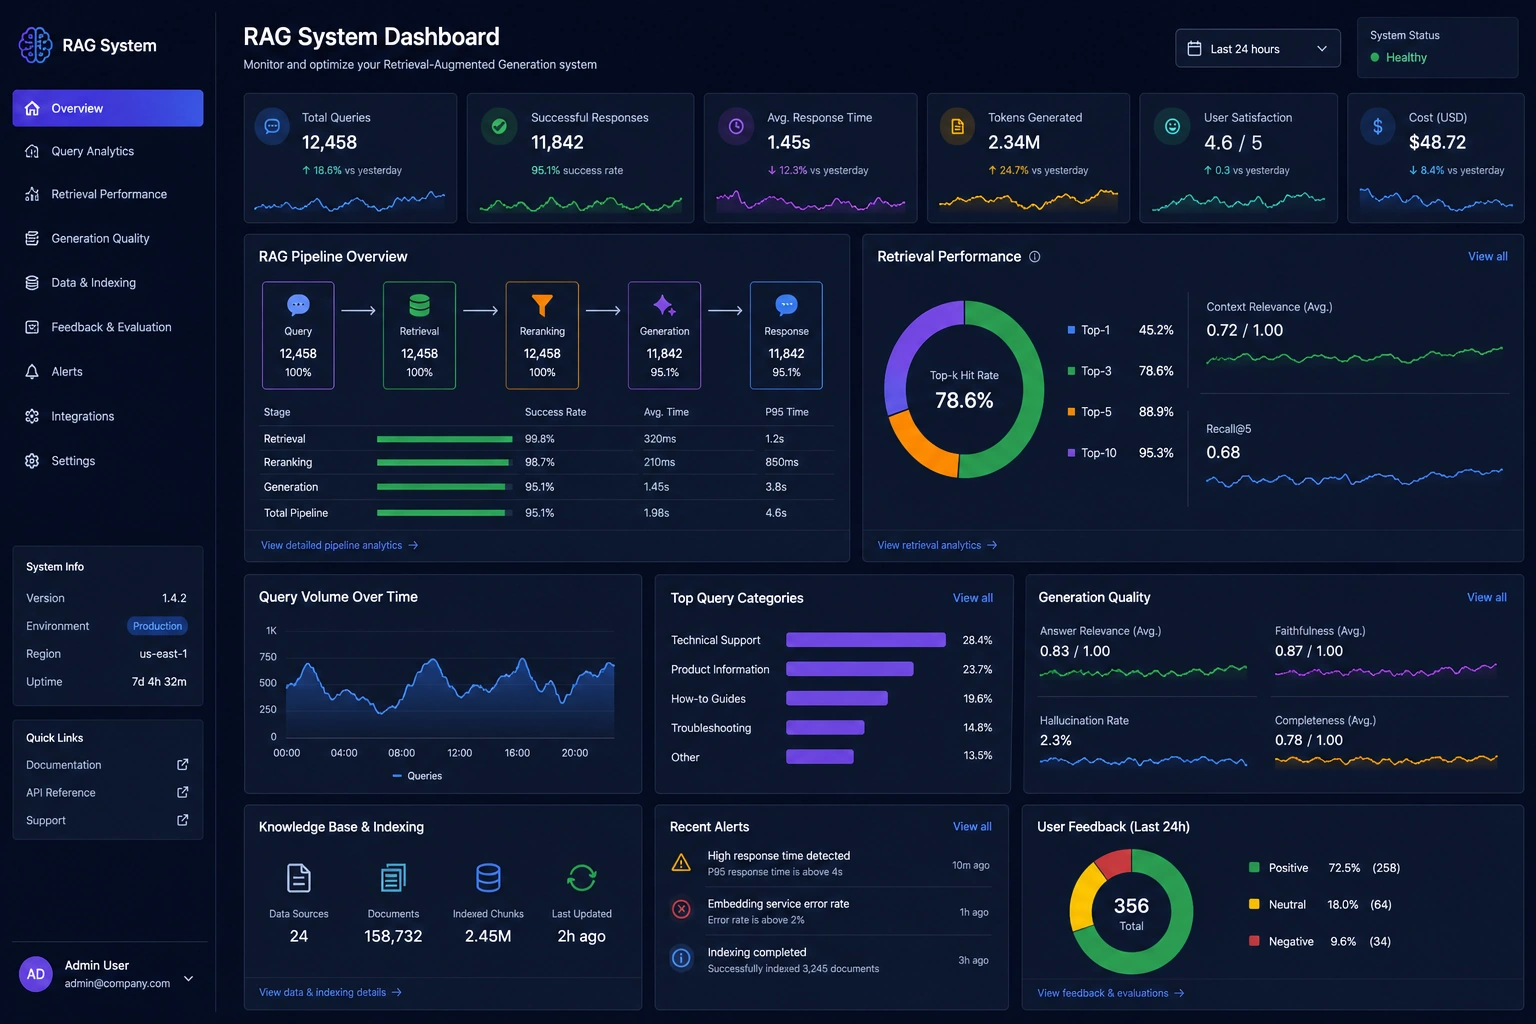
Retrieval-Augmented Generation (RAG) System Dashboards - A Retrieval-Augmented Generation (RAG) system dashboard exists to answer one core question: “Is the system reliably finding the right information and using it to generate trustworthy answers at an acceptable cost and speed?” To do that, it tracks metrics across three layers: retrieval, generation, and system/business performance. By monitoring retrieval metrics, you ensure the system pulls relevant information from your knowledge base. Through generation metrics, you validate that answers are accurate and faithful to the retrieved content...
Risk Free Dashboard Offer - We create dashboards with your data (or mentor you to do so) You use the dashboards for free (as a single user). Easily prepare data and design dashboard reports in a single web app Built-in, in-depth self-service dashboarding for all users Bring reporting software to your data, in-cloud or on-premise. Built-in, in-depth interactivity and customization allows business users to dynamically reshape pre-designed dashboards for changing business needs with zero training. Self-service dashboarding further empowers business users with direct access to underlying data assets in a governed and secure environment. Designers can prepare and mashup data from many data online and on-premise sources. Dashboard design is integrated with data preparation in a single web app. The same web app is also user portal where designers can engage business users even during dashboard design...
Risk Register Dashboard - Why It's Vital You Create a Risk Register Any business that wants to stay ahead of disruption and maintain its competitive advantage must know how to manage risk. Whether financial, operational, or reputational, risks come with a high cost. Several companies have gone out of business due to poor risk management. As a business leader, a project leader, or a risk officer, it's crucial to prioritize risk management to ensure you steer your organization in the right direction. One place to start is to understand the concept of a risk register. We have highlighted more about a risk register in the sections below...
Rocket Launch Operations Dashboards - A rocket launch is one of the most complex engineering operations undertaken by humankind. It involves thousands of interconnected systems, strict timing constraints, volatile propellants, and rapidly changing environmental conditions. To manage this complexity, modern spaceflight operations rely heavily on centralized monitoring systems known as rocket launch operations dashboards. These dashboards aggregate telemetry, system health data, environmental measurements, and procedural milestones into a single, coherent visual interface that supports decision-making in real time. The Rocket Launch Operations Dashboard presented here is inspired by modern infrastructure monitoring tools and adapts their proven visual language to the unique demands of launch operations. The primary purpose of a rocket launch operations dashboard is to provide launch controllers with immediate situational awareness. During countdown and launch, there is no time to manually correlate data from separate systems. Engineers, flight directors, safety officers, and weather specialists must all see a shared operational picture. The dashboard consolidates critical information so that anomalies can be detected early, trends can be evaluated quickly, and go/no-go decisions can be made with confidence...
Role Based Dashboard Software - Are you looking for a good role based dashboard application? InetSoft's pioneering dashboard reporting software permits very granular permission control, by role or group, by individual user, by dashboard, and by database security preferences. InetSoft's pioneering dashboard reporting application produces great-looking web-based dashboards with an easy-to-use drag-and-drop designer. Maximize self-service for all types of users. No dedicated BI developer required. View a demo and try interactive examples...

SaaS Dashboard Software - Are you looking for good SaaS dashboard software? InetSoft's pioneering dashboard reporting solution is designed for embeddding into other applications. InetSoft's solution is true Software-as-a-Service for hosted and self-hosting, not a combination of client developer tools and a web-based delivery platform. All new clients and partners get free one-on-one business intelligence expert help to accelerate deployment. Get cloud-flexibility for your deployment. Minimize costs with a small-footprint solution. Maximize self-service for all types of users. No dedicated BI developer required. View a demo and try interactive examples...
Safety Dashboard Examples A safety dashboard is a management tool that will allow an orgainization to keep track of all aspects of their risk related activity. Below are examples of safety dashboards built with InetSoft's easy-to-use dashboard software. For example, this mortality dashboard breaks down death causes among the general population by age, sex, and ethnicity...
Sage Dashboard Solution Alternative - Are you looking for a good alternative dashboard solution for Sage ERP? InetSoft's pioneering dashboard reporting application produces great-looking web-based dashboards with an easy-to-use drag-and-drop designer. Mash up construction ERP data with other data in your organization. Get cloud-flexibility for your deployment. Minimize costs with a small-footprint solution. Maximize self-service for all types of users. No dedicated BI developer required. View a demo and try interactive examples...
Sales CRM Dashboard for Pipedrive - Looking for a good solution for Pipedrive dashboard reporting? InetSoft's pioneering BI application produces great-looking dashboards that give you more self-service analytic capabilities. View a demo and try interactive examples...
Sales Dashboard Application for Zendesk - Looking for a good solution for Zendesk Sell dashboard reporting? InetSoft's pioneering BI application produces great-looking dashboards that give you more self-service analytic capabilities. View a demo and try interactive examples...
Sales Dashboard Creation Steps - This document will explain how to create a sales dashboard such as the one below using dashboard creation software from InetSoft. A working version of this dashboard can be found on the InetSoft Gallery. This dashboard is primarily composed of a large number of charts. Below, we will examine some of these charts, and see how easy they are to create. First consider the following chart, which shows summed revenue broken out by product line and type, with year represented by color. The chart in the sample dashboard uses a minimalist aesthetic by hiding all labels, but we will keep the labeling for clarity. The Chart provides a basic overview of which products are producing revenue and is therefore a key chart for assessing sales performance...
Sales Dashboard Examples - If you are looking for dashboard ideas, take some time to examine these sales dashboard examples. Hosted by InetSoft these interactive and dynamic dashboards show off a wide range of visual styles and features. Right away you will notice a variety of different charting styles, as well as the highly graded drill-ability with selection boxes, drop down menus and range sliders. The more you experiment with this sales dashboard sample the more you will see how powerful the program running it must be. That program is InetSoft's flagship...

Sales Dashboard To Manage Pipeline And Analyze Opportunities - Looking for a sales dashboard to manage the pipeline and analyze opportunities? Since 1996 InetSoft has been making business dashboard software that is easy to deploy and use. InetSoft's server-based dashboard application can access your sales data no matter where it is saved, even from salesforce.com, and deliver interactive dashboards in any Web browser including on mobile devices...
Sales Dashboarding Tool for Freshservice - Looking for a good solution for Freshservice dashboard reporting? InetSoft's pioneering BI application produces great-looking cloud-based dashboards with an easy-to-use drag-and-drop designer. Mashup your service desk data with other enterprise data for a wider picture of performance. View a demo and try interactive examples...
Sales KPI Dashboard - Ensuring a well-set up and analyzed sales KPI dashboard is useful in ensuring further sales growth. By understanding exactly where, when, why, and how sales increase or decrease, business owners are able to raise sales long-term. InetSoft's dashboard reporting software is beneficial for sales teams and managers to keep track of their KPI's. And the great news is that it's easy to learn with minimal training and support from IT. Sales KPI Dashboards can be drafted within a short amount of time through self-service due to InetSoft's user-friendly interface, and easy point-and-click controls...
Sales Lead Tracking Dashboard - At InetSoft, we've just begun using a new dashboard for tracking our sales lead. You can see an example of this dashboard (with obscured information, of course) in the screenshot below. Essentially, what this dashboard does for us is allows our sales team to keep track of how many times a lead was emailed, called, or otherwise contacted by employees or automated measures. It provides our sales team with useful, actionable information that enhances lead conversion...

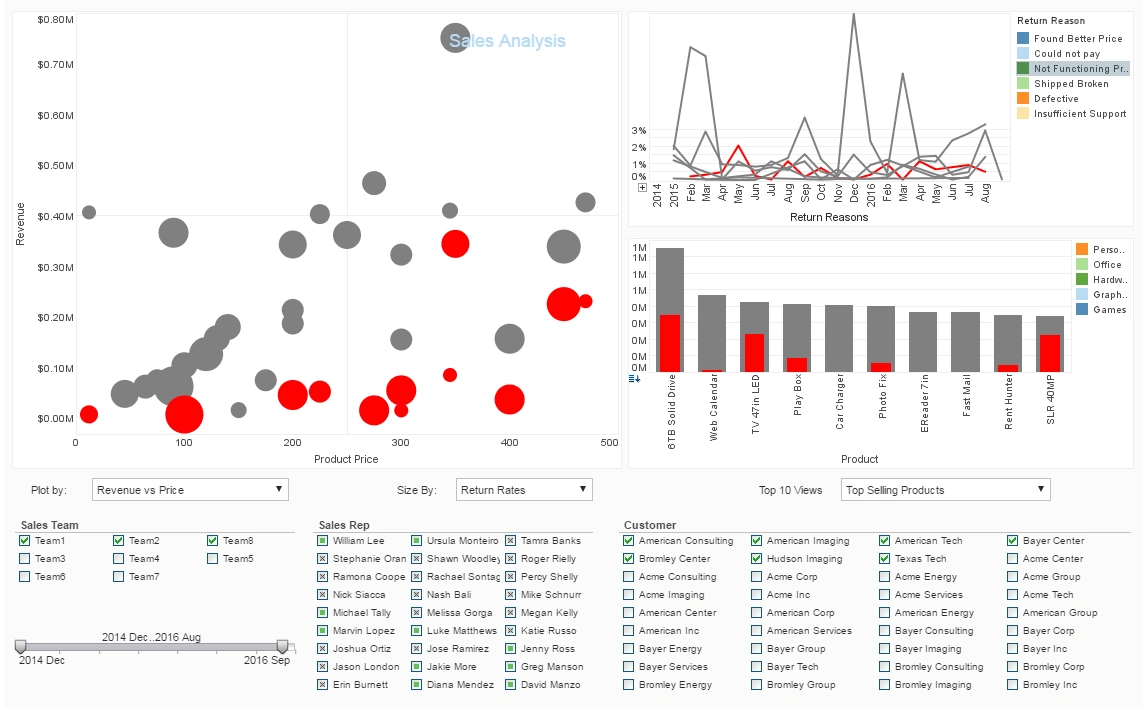
Sales Performance Dashboard Example - Dashboards are powerful tools for doing just that. The sample dashboard provided tracks many key performance indicators in a highly visual and digestible manner. This dashboard displays a large amount of information in a small dynamic range. It uses a large number of common KPI to track the overall performance of a theoretical business. The first graph shows a huge amount of info. It not only gives the user information on how much each company is making, but also what products they are selling to do so. The graph next to it provides even more information. It tells how well each sales representative is doing in addition to the product they are selling, and how much clients are buying. The third graph gives information about how much money each sales representative is brining into the company and if they are using discounts to do so. The final two graphs give meaning to purchase quantities, delivery times, products purchased, prices, and products returned...
Sales Performance Tracking Dashboard Software - Sales performance tracking is one of the most critical analytics workflows in any organization. Whether you’re running a small sales team or managing a multi‑region operation, you need clear visibility into pipeline health, closed‑won revenue, conversion rates, and rep‑level performance. Spreadsheets and ad‑hoc reports can work for a while, but they quickly become fragile and time‑consuming. Dedicated dashboard software solves this by connecting directly to your CRM and other data sources, updating metrics automatically, and presenting everything in a visual format that sales leaders and reps can understand at a glance. The question isn’t whether you need dashboards—it’s which software you should use. The best options for sales performance tracking combine real‑time data refresh, customizable layouts, governed metrics, drill‑down capabilities, and AI‑driven insights. In this guide, we’ll look at several leading platforms, with a particular focus on InetSoft StyleBI, and compare them side by side so you can choose the right fit for your sales organization.
Salesforce Dashboard Builder - Are you looking for a good dashboard builder for salesforce? InetSoft's pioneering dashboard reporting application produces great-looking web-based dashboards with an easy-to-use drag-and-drop designer. Get cloud-flexibility for your deployment. Minimize costs with a small-footprint solution. Maximize self-service for all types of users. No dedicated BI developer required. View a demo and try interactive examples...
Salesforce Dashboards - InetSoft's StyleBI for Salesforce is a SaaS application salesforce.com users can install into their environment to gain advanced dashboard and reporting capabilities for their sales, marketing, and now customer service operations data. The application comes with eight pre-built monitoring and visual analysis dashboards that provide immediate productivity. With simple point and click functionality, users can adjust the views into their data and customize their own versions of pre-built dashboards. Also included is a drag-and-drop dashboard and analysis designer tool that permits quick development of new dashboards or analysis of salesforce.com data including those in custom fields. StyleBI for Salesforce automatically saves daily snapshots of your Salesforce data and records all of the changes. Now you can: * Measure sales success rates of campaigns from start to finish. * Compare the current performance of your marketing campaigns to previous ones...
Salesforce Dashboard Report Alternative - Looking for a good solution for Salesforce dashboard reporting? InetSoft's pioneering BI application produces great-looking dashboards that give you more self-service analytic capabilities. View a demo and try interactive examples...
Sample Dashboards - View sample dashboards built with InetSoft's Java-based dashboard application, some of which you can explore with the free evaluation copy of StyleBI, which permits a 5-day self-evaluation...