Evaluate InetSoft's WordPress Dashboard Application
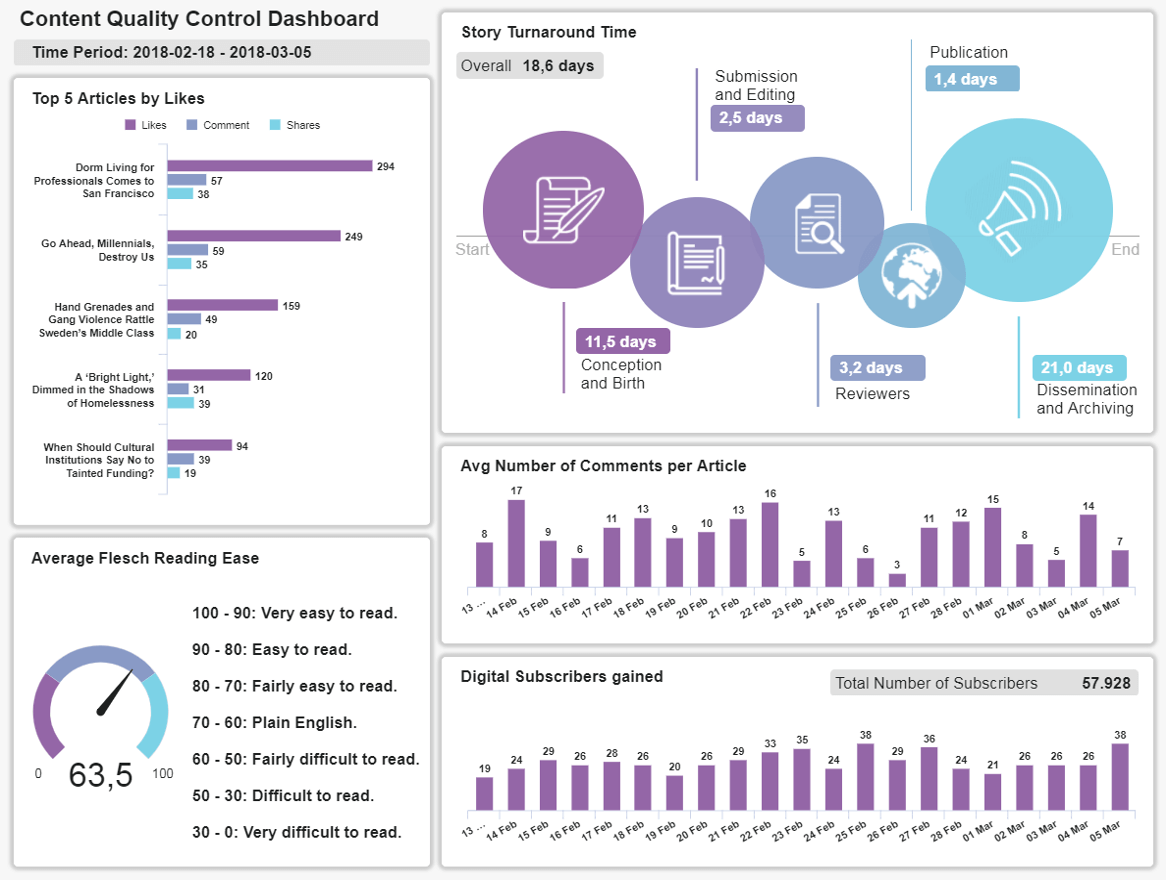
Are you looking for a good solution for WordPress dashboard analytics? InetSoft's pioneering BI application produces great-looking dashboards that mashup content creation data with other marketing campaign data and give greater self-service to all types of users in your organization. View a demo and try interactive examples.

Register for more information and a personalized demo
About InetSoft
Since 1996 InetSoft has been delivering easy, agile, and robust business intelligence software that makes it possible for organizations and solution providers of all sizes to deploy or embed full-featured business intelligence solutions. Application highlights include visually-compelling and interactive dashboards that ensure greater end-user adoption plus pixel-perfect report generation, scheduling, and bursting. InetSoft's patent pending Data Block™ technology enables productive reuse of queries and a unique capability for end-user defined data mashup.
This capability combined with efficient information access enabled by InetSoft's visual analysis technologies allows maximum self-service that benefits the average business user, the IT administrator, and the developer. InetSoft was rated #1 in Butler Analytics Business Analytics Yearbook, and InetSoft's BI solutions have been deployed at over 5,000 organizations worldwide, including 25% of Fortune 500 companies, spanning all types of industries.

More Resources and Articles about InetSoft's WordPress Dashboard Application
Adding a Parameter to a Report - Adding a report parameter is easy with InetSoft's reporting software and its robust tool set. View the example below to learn more about the StyleBI solution...
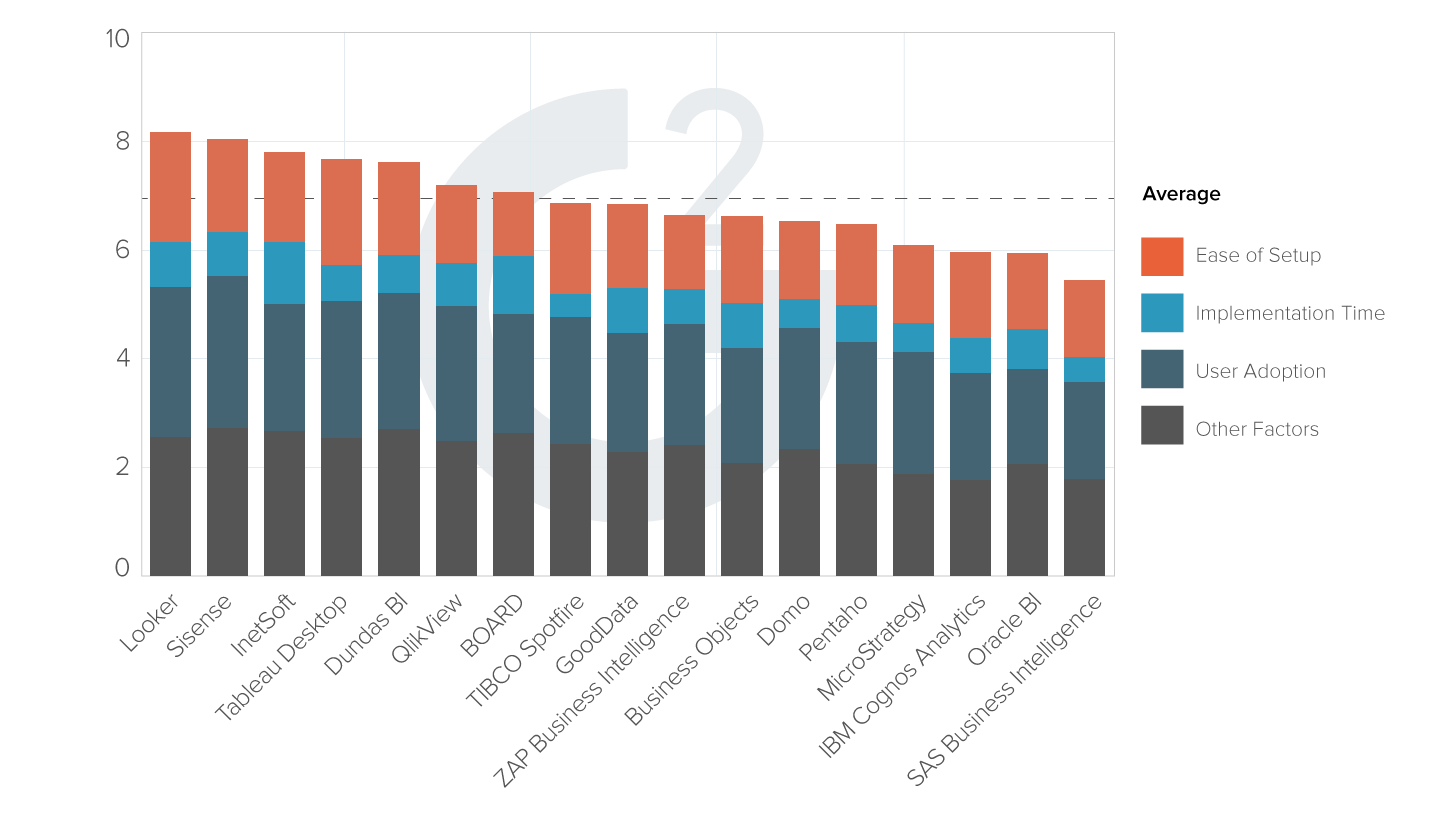
| #1 Ranking: Read how InetSoft was rated #1 for user adoption in G2's user survey-based index | Read More |
Built-in Interactivity for Dashboards - The Designer provides the embedded Script implementation of all the methods discussed in this section. It is better to use the Designer to specify links and interactions, only using the API described below if the desired feature cannot be implemented from the visual interface...
Conditional Formatting Text Colors in a Table - This example sets the text colors and fill colors of table cells based on data values within the table. If a price is greater than $1000, the price displays in red text, otherwise, in blue text...
Controlling Dashboard Input Type - This example uses a RadioButton to give the user a choice of two input options, a Selection List, and a Range Slider. Follow the steps below...
Dashboard Analytics Provider: InetSoft - Are you looking for a good dashboard analytics provider? Since 1996 InetSoft has been making BI software that is easy to deploy and easy to use. Build self-service oriented dashboards and visual analyses quickly. InetSoft's data mashup engine solves the data access and transformation challenges that other tools cannot. View a 3-minute demo and read customer reviews...
 |
View live interactive examples in InetSoft's dashboard and visualization gallery. |
Dashboard Definition - Dashboard software, sometimes referred to as digital dashboards or data dashboards, is often analogized to the dashboard in a car. This analogy is a starting point, but it is far from capturing all the ideas embedded in dashboard software. On a high level, dashboard software is a versatile visual app that converts data into useful information...
Data Intelligence for Utilities - Utility companies face quite a few challenges today from maintaining infrastructure, combatting natural events, tackling a host of competitors sprung from deregulation, to being one of the main targets for cyber attacks. InetSoft's business intelligence tool can be a main weapon to win the battles...
Deploy Reports to a Web Server - One of the easiest ways to deploy reports to a web server is using the Live Deploy feature of the Report Designer. Once a report is deployed, users can view it within the Report Portal. In the following example, you will deploy the "Sample Sales Report" report that you saved in the previous section...
Designing Company Dashboard Charts - The Chart Editor automatically categorizes numerical fields of a Data Block as "measures" and non-numerical fields as "dimensions." Typically, dimensions are used as X-axis data, and measures are used as Y-axis data. Only dimensions can be used in the 'Breakdown by' field of the 'Data' panel...
 |
Read the top 10 reasons for selecting InetSoft as your BI partner. |
Displaying Dashboard Data Table - Users have the ability to display live data using InetSoft's award-winning dashboard software, an all-in-one business intelligence solution for mid-sized and large enterprises than comes as a stand-alone or embeddable solution. View the example below to learn more about the StyleBI solution...
Example of a Production Dashboard - Using production performance data to create metrics for companywide use, InetSoft's production dashboard application measures output performance and identifies input problems...
Executive Level Metrics Dashboard - It's probably not a good idea to mix up the audiences and intentions of dashboards. It doesn't make sense for senior executives to drill down too granularly. Do they have time to really look at the details of every marketing campaign. Would they understand what they are looking at? Summary-level views are best for them...
How to Add Hyperlinks in Reports - You can add hyperlinks to certain report elements, targeting another report or a URL. Hyperlinks can be associated with Text, Textbox, Table, Section, and Chart elements. For exported reports, hyperlinks are supported in 'PDF', 'HTML' and 'RTF' formats. If the hyperlink is associated with a Table, Section, or Chart, you can pass the contents of the clicked element as a parameter to the drill-down report or URL...
Read what InetSoft customers and partners have said about their selection of Style Report as their production reporting tool. |
How To Create Portlet Dashboards - InetSoft's sophisticated dashboard software allows users to create portlet dashboards that have the look and feel of a modern simple-to-use webpage. View the information below to learn more about the StyleBI solution...
InetSoft as a SQL Report Builder - Looking for a way to build professional reports with data from a SQL Server? InetSoft's Style Report can query Microsoft SSAS cubes through MDX, for the easy creation of mashup driven, pixel-perfect reports...
Manufacturing Metrics KPI Dashboard Example - Manufacturing processes generate volumes of data that must be monitored and analyzed for peak performance and efficiency. By observing and analyzing these processes, companies can gain an understanding of the different shifts and trends which progress and hinder their business. This knowledge provides managers with great insight to act accordingly and make decisions in a confident manner...
Read what InetSoft customers and partners have said about their selection of Style Scope for their solution for dashboard reporting. |
Put Interactive Forms in a Report - Report Designer supports data entry and report customization through interactive forms. A form is a collection of interactive controls, such as Text fields, Radio Buttons, and Combo Boxes. Interactive forms are used primarily in two roles: Embedded in reports to allow report customization, and embedded in parameter sheets to allow parameter entry...
Replet to Collect User Input - While simple replets such as the one in the previous example are very useful, the replet API enables the building of much more powerful and flexible replets. An important concept is that of parameterized reports. Parameterized reports allow the replet to collect user input before or after report creation. It is up to the replet to use the parameter values to customize the final report...
Resources about Designing Reports - This is a table of contents of useful product documentation about designing reports using InetSoft's reporting product, Style Report Enterprise, which is is included in InetSoft's business intelligence software for dashboards, reporting, and analytics, StyleBI...
Show a Good Report Designer - Not only does our software, StyleBI™ enable the creation of production reports and supports end-user driven ad hoc reporting, it also enables writing back to databases. So now you can quickly build reports, based from the web, that can both visualize and update data. Build reports from almost any data source and provide controlled forms for updating or inputting information...
Learn how InetSoft supercharges BI with Spark to make machine learning easy. |
Starting a University Dashboard - When you start out making a dashboard, just try some metrics and see if they work for you. And if they don't work, change them. Add to them. Figure it out. I wanted every unit reporting to me to have some measure in the dashboard...
Supply Chain Management KPI Dashboard Example - The model dashboard to the right provided tracks many key performance indicators at the global level, all in a highly visual and comprehensive manner. The boxes on the right portion of this display are a filter which would provide the live dashboard with interactivity and drilldown capability. InetSoft's StyleBI offers a variety of chart and display types, enabling you to employ unique visual styles to display information in a compact manner which communicates actionable insights...
Tips for Building a Great Dashboard - When you're designing a dashboard, start thinking about what you wish to accomplish. For example, maybe you want it to help your employees work more efficiently, or you want the whole team to focus on specific objectives. Here are some questions you may ask yourself when creating a dashboard...
Try InetSoft's Dashboard Reporting Tool - Looking for a dashboard reporting tool? Since 1996 InetSoft has been making dashboard software that is easy to deploy and easy to use. Build self-service oriented dashboards quickly . View a demo and read customer reviews...


