Evaluate InetSoft's Application for Web Dashboards
Are you looking for a good application for web dashboards? InetSoft is a pioneer in self-service dashboarding with pricing comparable to Power BI. View a demo and try interactive examples.

Register for more information and a personalized demo
About InetSoft
Since 1996 InetSoft has been delivering easy, agile, and robust business intelligence software that makes it possible for organizations and solution providers of all sizes to deploy or embed full-featured business intelligence solutions. Application highlights include visually-compelling and interactive dashboards that ensure greater end-user adoption plus pixel-perfect report generation, scheduling, and bursting. InetSoft's patent pending Data Block™ technology enables productive reuse of queries and a unique capability for end-user defined data mashup.
This capability combined with efficient information access enabled by InetSoft's visual analysis technologies allows maximum self-service that benefits the average business user, the IT administrator, and the developer. InetSoft was rated #1 in Butler Analytics Business Analytics Yearbook, and InetSoft's BI solutions have been deployed at over 5,000 organizations worldwide, including 25% of Fortune 500 companies, spanning all types of industries.

What Metrics and KPIs Do Organizers of Music Festivals Use on Web Dashboards?
Organizers of music festivals use web dashboards to monitor various aspects of festival planning, promotion, operations, and attendee engagement. These dashboards help organizers track key performance indicators (KPIs) and metrics to ensure the success of the event and optimize the overall festival experience. Here are some common metrics and KPIs used on web dashboards by organizers of music festivals:
-
Ticket Sales and Revenue: Tracking ticket sales metrics, including the number of tickets sold, revenue generated, average ticket price, and sales trends over time, helps organizers assess the financial performance of the festival and make informed decisions about pricing, promotions, and capacity management.
-
Attendance and Capacity Utilization: Monitoring attendance metrics, such as the number of attendees, demographics (e.g., age, gender), geographic distribution, and ticket redemption rates, helps organizers estimate crowd size, manage venue capacity, and ensure a safe and enjoyable experience for festival-goers.
-
Social Media Engagement: Analyzing social media metrics, including followers, likes, shares, comments, and mentions across various platforms (e.g., Facebook, Twitter, Instagram), provides insights into audience engagement, brand awareness, and the effectiveness of marketing campaigns and promotional activities.
-
Website Traffic and User Behavior: Tracking website metrics, such as website traffic, page views, bounce rate, and conversion rate, helps organizers assess the effectiveness of their online presence, website performance, and digital marketing efforts in driving traffic and conversions.
-
Artist and Lineup Performance: Monitoring metrics related to artist and lineup performance, including artist popularity, fan engagement, ticket sales attributed to specific artists, and audience satisfaction ratings, helps organizers evaluate the appeal and impact of the festival lineup and make data-driven decisions about future bookings.
-
Vendor and Sponsor Performance: Tracking metrics related to vendor and sponsor performance, such as vendor sales, sponsorship revenue, booth traffic, and sponsor activation metrics, helps organizers assess the ROI for vendors and sponsors, optimize vendor placement, and cultivate long-term partnerships.
-
Customer Satisfaction and Feedback: Collecting feedback from attendees through surveys, ratings, and reviews helps organizers gauge customer satisfaction levels, identify areas for improvement, and address concerns or issues in real-time to enhance the overall festival experience.
-
Logistics and Operations Management: Monitoring operational metrics, such as venue logistics, staffing levels, vendor setup times, security incidents, and emergency response times, helps organizers ensure smooth and efficient festival operations, mitigate risks, and address logistical challenges as they arise.
-
Environmental Sustainability: Tracking sustainability metrics, such as waste diversion rates, energy consumption, carbon emissions, and eco-friendly initiatives (e.g., recycling programs, renewable energy sources), helps organizers minimize the environmental impact of the festival and promote sustainability practices among attendees and stakeholders.
-
Revenue and Expense Tracking: Monitoring financial metrics, including overall revenue, expenses, budget vs. actuals, profit margins, and return on investment (ROI), helps organizers manage festival finances effectively, control costs, and maximize profitability while delivering value to attendees and stakeholders.
More Resources and Articles about InetSoft's Application for Web Dashboards
Access Dashboard Creator - Searching a Microsoft Access dashboard builder? InetSoft offer free and commercial Web-based dashboarding software that connects to MS Access and other data sources. The drag and drop designer makes design easy and quick. The chart engine makes attractive looking charts, and the toolbox includes many choices of dashboard components like gauges and speedometers...
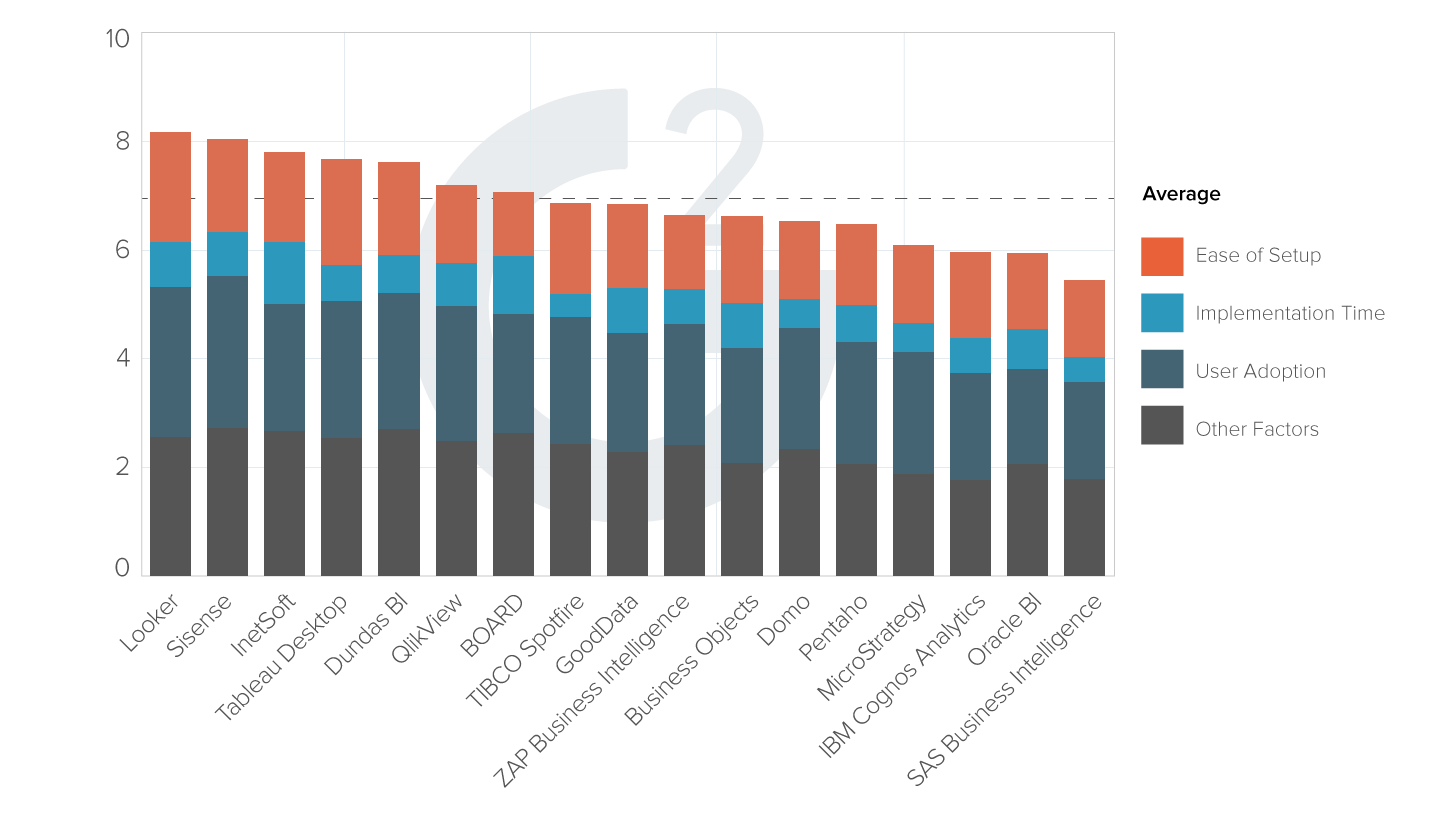
| #1 Ranking: Read how InetSoft was rated #1 for user adoption in G2's user survey-based index | Read More |
Attorney Dashboard Application - Looking for a tool for a good lawyer dashboard application? InetSoft is a pioneer in self-service dashboarding and offers a solution perfect for lawyers...
Business Intelligence for Insurance - The data management needs of insurance companies are among the largest, most diverse, and most complex of any major industry. InetSoft's data intelligence platform can serve as the unification solution to disparate and seemingly unwieldy data sources while providing a vantage point...
Comparing Balanced Scorecards to Dashboards - How dow you compare a balanced scorecard versus a dashboard? Balanced scorecards can be thought of as a type of dashboard. The difference is a scorecard is defined kind of view of corporate performance, covering most...
Dashboard Business Intelligence Apps - Looking for dashboard apps? InetSoft offers free and commercial Web-based dashboard software. View a demo. Try today for free...
 |
View live interactive examples in InetSoft's dashboard and visualization gallery. |
Dashboard Reporting Samples - Since 1996, InetSoft's dashboard software StyleBI uses a reporting-driven approach to enable rapid deployment of BI dashboards. They are business user-driven and offer strong reporting tools and functions. Dashboard software has been established as a highly effective business intelligence tool...
Dashboard Tool for Amazon AWS - InetSoft's dashboard tool can easily connect any in-cloud data sources for both in-cloud and on-premises deployment. Salesforce, Facebook and Google Analytics are just a few examples. Because InetSoft's StyleBI is a 100% web app, it is best suited for in-cloud business intelligence...
Data Intelligence for Healthcare - Healthcare organizations gather a large amount of data. Effectively utilizing data is crucial for delivering world class results. Healthcare also spans highly interconnected sectors such as academics, hopsitals and pharmaceuticals. Data and its analysis sharing can be highly automated with data intelligence tools...
Database Dashboard Samples - Is your business using database dashboards? These dashboards offer companies a unique way of representing their data. From sales projections, to employee statistics, and even inventory stock, database dashboards are able to easily represent all of the numerical data that your company can hold, into a visually appealing dashboard...
 |
Read the top 10 reasons for selecting InetSoft as your BI partner. |
Departmental BI Dashboards - Looking for department BI dashboards? InetSoft's industry pioneering BI platform can support any department's business intelligence needs. View examples in the showcase, read articles about its capabilities below, and request a personalized demo...
Digital Dashboard Solution - Looking for digital dashboard software? InetSoft offers Web-based dashboard software that enterprises can deploy quickly, and ISV's can embed easily into their own applications. View a demo. Read customer reviews...
Dashboard Analytics for Excel Users - Excel is great for KPI calculations and serves as an easy ad hoc database for many departments. They can drive weekly or even daily performance management reporting from PowerPoint slides or macro-driven workbooks...
Download a Web-based Dashboard Application - Are you looking to download a web-based dashboard application? Since 1996 InetSoft has been making business software that is easy to deploy and easy to use. Build self-service oriented interactive dashboards quickly. View a demo and download one of our applications for free...
Read what InetSoft customers and partners have said about their selection of Style Scope for their solution for dashboard reporting. |
Evaluate InetSoft's Dashboard Software - Looking to evaluate a dashboard solution? InetSoft offers Web-based dashboard reporting software that enterprises can deploy quickly, and ISV's can embed easily into their own applications. Free eval download. View a demo. Read additional resources below...
Executive Scorecard Dashboards - Executive scorecards present strategic business KPIs that are normally implemented with visualization dashboards. The strategic nature of scorecards makes their style of dashboard noticeably different from operational dashboards...
Flexible Dashboard Chart Product - Charts are the easiest to understand visualization tool, and InetSoft offers many choices with its dashboard product...
Google Apps Engine Dashboards - Looking for dashboard reporting tools to run on Google Apps Engine? As a Java-based Web application, InetSoft's StyleBI is one of the few enterprise-grade reporting applications that run in the Google Apps Engine environment. An easy-to-use drag and drop designer lets you quickly build impressive interactive dashboards and visualizations...
Learn how InetSoft's data intelligence technology is central to delivering efficient business intelligence. |
How to Replace Tableau's Visualization Dashboard Application - Are you looking for alternative to Tableau's visualization software? InetSoft offers a Web-based Tableau alternative that is better suited to enterprises and OEMs, yet is easy to deploy and use. Since 1996 InetSoft has been offering business intelligence applications that are flexible and powerful, serving over 5,000 enterprises and solution providers worldwide....
Information about Portal Dashboards - These pages are useful resources about InetSoft's dashboard software, which has been optimized for embedding into enterprise portals or any ISV's Web-based application...
Layout Designer for Dashboards - Trying to see how to layout a dashboard? Look at dashboard design examples and templates built with InetSoft's Web-based dashboard software. With a drag and drop designer and a library of common dashboard elements, you can quickly create attractive interactive dashboards. Visit the StyleBI product page to learn more, see examples, view a demo, and read customer reviews...
Medical Dashboard Samples - Are you looking for medical dashboard examples? Try out this interactive Mortality Analysis dashboard from the InetSoft live dashboard gallery. This dashboard was made with InetSoft's commercial dashboard builder StyleBI...
 |
Learn how InetSoft's data intelligence technology is central to delivering efficient business intelligence. |
Metrics Dashboard Samples - Below are metrics dashboard examples designed using InetSoft's data mashup driven web app, StyleBI. These dashboards focuses on key metrics...
Searching for a Commercial Business Dashboard - Dashboards create visual representations of metrics and performance scorecards at a specific point in time. In order for a manager to fully understand the status of key performance indicators, it is a necessity to have an advanced and interactive dashboarding tool...
Templates of Department Dashboards - Looking for department dashboard templates. Get inspired from these examples created with InetSoft's easy-to-use web-based dashboard application...
Top 10 List for Dashboards - In the world of business intelligence, what would qualify as a 'top 10' dashboard tool? With so many new dashboard tools and BI solution systems, it can become a headache searching for the right solution for your organization...
 |
Learn how InetSoft's native big data application is specifically designed for a big data operating system. |
Web Dashboard Integration -
The InetSoft Dashboard uses the Apache Pluto
implementation of the Java Portlet Specification, specified by JSR 168, and can run in any servlet container.
To use the InetSoft Dashboard solution in a web application context root...
Web App for Dashboarding - Looking to view and/or build dashboards via a web app? InetSoft's dashboard web application can be installed either on-premise or in the cloud, on a remote server provided by Amazon web services or any other provider...


