Getting a Data Integrator Solution Combined with a BI Platform
InetSoft's application goes beyond traditional business intelligence tools by serving as a robust data integration platform as well as a visualization solution.
Rather than simply presenting pre-aggregated metrics, it unifies, transforms, and governs data from multiple sources to create a consistent analytical foundation.
The following points explain how this integrated approach delivers significant advantages over a dashboard-only solution.


-
Unified Data Access Across the Enterprise
- InetSoft's application functions as a comprehensive data integrator, connecting to relational databases, cloud applications, data warehouses, spreadsheets, APIs, and big data platforms.
- Instead of forcing organizations to move all data into a single repository, it supports live connections and hybrid models.
- This enables real-time and near-real-time access to operational and analytical data without excessive replication.
- A dashboard-only solution typically visualizes pre-prepared datasets, limiting flexibility and increasing dependency on IT for new data requests.
-
Built-In Data Transformation and Preparation
- The application includes data mashup capabilities that allow users to join, blend, aggregate, and transform disparate datasets within the platform.
- Business users can create reusable data models without writing complex code.
- Data cleansing, calculated fields, and derived metrics can be defined centrally and governed consistently.
- Dashboard-only tools often require external ETL tools or manual preparation before visualization, increasing complexity and cost.
-
Agile Data Mashup Without Heavy ETL
- InetSoft’s data mashup engine supports rapid prototyping of analytics by combining sources on demand.
- Users can create logical data models without waiting for traditional ETL cycles.
- This reduces time-to-insight for evolving business questions.
- A dashboard-only solution generally relies on pre-modeled data structures that can slow response to changing requirements.
-
Reusable Semantic Layer
- The application provides a semantic layer that standardizes definitions for KPIs, metrics, hierarchies, and dimensions.
- This ensures consistent calculations across reports, dashboards, and self-service analytics.
- Changes to business logic can be centrally managed and automatically reflected across all visual assets.
- Dashboard-only tools often duplicate metric definitions across dashboards, increasing risk of inconsistency.
-
Embedded Data Governance and Security
- Role-based access control applies at the data, column, and row levels.
- Security rules propagate through visualizations and reports automatically.
- Multi-tenant environments can securely isolate departments, customers, or partners.
- Dashboard-only solutions may focus primarily on front-end permissions, leaving upstream data governance gaps.
-
Real-Time and Operational Analytics
- Live connections to transactional systems enable operational dashboards that reflect current conditions.
- Streaming or frequently refreshed data can be integrated into the same analytical environment.
- This supports use cases such as monitoring, alerts, and exception management.
- Dashboard-only tools that rely on static extracts cannot easily support operational decision-making.
-
Reduced Architecture Complexity
- InetSoft consolidates integration, modeling, reporting, and dashboarding into a single platform.
- Organizations can reduce reliance on multiple vendors for ETL, data prep, semantic modeling, and visualization.
- This lowers licensing, maintenance, and integration overhead.
- Dashboard-only solutions often require a separate data integration stack, increasing total cost of ownership.
-
Self-Service with IT Control
- IT teams can publish certified data sources and business logic.
- Business users can extend and personalize analyses within governed boundaries.
- This balances agility with data quality and compliance.
- Dashboard-only tools frequently push data preparation entirely upstream, limiting meaningful self-service.
-
Scalable Deployment Options
- The application supports on-premises, cloud, and hybrid deployments.
- It scales from departmental projects to enterprise-wide analytics initiatives.
- Performance optimization features support high user concurrency and large data volumes.
- Dashboard-only tools may scale visually but still depend on external systems for heavy data processing.
-
Advanced Analytics Foundation
- Integrated data preparation and modeling create a strong foundation for predictive analytics and advanced calculations.
- Users can build complex KPIs, trend analyses, and scenario comparisons directly within the platform.
- Data integration capabilities make it easier to combine historical, operational, and external data sources.
- Dashboard-only solutions typically focus on descriptive visualization rather than comprehensive analytical workflows.
-
Faster Time-to-Value
- Organizations can connect, model, and visualize data within a unified environment.
- New data sources can be incorporated quickly without redesigning the architecture.
- Reusable components accelerate future analytics initiatives.
- Dashboard-only approaches often require additional integration projects before insights can be delivered.
-
Strategic Advantage Over Dashboard-Only Solutions
- InetSoft’s application is not limited to presenting metrics; it actively integrates and harmonizes data across systems.
- This transforms analytics from a reporting layer into a strategic data infrastructure.
- Organizations gain flexibility, consistency, and long-term scalability.
- Dashboard-only solutions remain dependent on external integration processes, limiting adaptability and enterprise impact.


More Articles About Data Integration and BI
Virtualizing Access to All Data Sources - This is the anti-silo approach. Clearly, this needs to be a unified and extensible set of applications that build on common reusable components. So often you’re driving towards real time or near real time data access which is essentially a cross platform silo agnostic infrastructure for multi-latency integration, batch, near real time, and real time that can all be accommodated as different delivery models within an end-to-end fabric. Then of course the semantic abstraction layer and registry are key of course to rolling up unified access, unified administration to all these disparate data repositories and so forth throughout your infrastructure. So if you build a semantic abstraction layer and registry, think of it in a broader sense which means it needs to be unified infrastructure where you maintain all the important artifacts which is metadata, which is schema definitions, which is business rules, predictive models, statistical models, a full range of report definitions, a full range of artifacts that are absolutely essential for maximum reuse across disparate BI efforts...
Virtualization Platforms Make Mashups Possible - Data mashup also has a second connotation in that it is more federated real time or right time as opposed to being persistent. There is value in persistent data which is typically found in enterprise data warehouses, marts, master data management systems, etc, but they live side by side in a sense with these virtualized data repositories. Again virtualization platforms make it possible to mash up all of your source systems including some of your transactional systems together into a data services layer. So as you will see today’s best of breed data virtualization platforms really are not just a data federation platform or an EII platform as in the past. They provide a broader range of virtualization across more structured and unstructured data and provide the data services capability. Now how does that relate to the rest of the layers? Obviously you have got infrastructure. You will have business processes or SOA types of middleware and message buses. You will have transaction systems, transactional services, applications, logic etc and analytical systems as well...
Visual Data Analysis - Visual data analysis is becoming one of the biggest trends for businesses across all industries, but what is it exactly and how can it benefit your business? Visual data analysis is the expansion of analytical reasoning to incorporate interactive visuals and dashboards.
Visual Data Mining - In modern day business, visual data mining is a technique that is increasingly providing a competitive advantage to those who want to harvest insights from their data to increase efficiency, spot trends, and get a better ROI on business efforts. This technique allows users to dynamically view the impact of different factors on data, helping companies with future decision making. InetSoft's award-winning visual data mining software takes data mining to a whole new level, combining data mining with high-performance visuals, interactive dashboards, and intuitive reporting. Using these features, business users can simultaneously extract information from multiple sources using data mashup technology...

Visualization Big Data - When dealing with big data, it can be difficult to find a software that allows you to present effective visualizations in order to gain greater insight into the information. However, with InetSoft's big data visualization software, users can create pixel-perfect interactive dashboards and reports with just a few simple clicks.
Visualization and Data Mashups - In May 2010, InetSoft's Product Manager Navish Javed participated in Information Management’s DM Radio Webcast, “The Last Mile: Data Visualization in a Mashed-Up.” The following is a transcript of that Webcast, which was hosted by Eric Kavanagh and included BI consultants William Laurent and Malcolm Chisholm. The topic for today is really interesting stuff. We’re talking about mashups. We’re going to find out what a mashup is all about. We had a little chat before the show, and there was some bantering going back and forth about a Business Week article back in 2007, perhaps, that said this is the year of the mashup, and well, it really wasn’t. But it’s not the first time the press has been a bit ahead of the game. But we’re going to find out from several experts what is going on in the field of data visualization and how mashups can really help you get a strategic view of enterprise data. So several great guests on today’s show, goodness gracious. We have several great guests. We have a couple expert guest hosts who are going to help us out today: William Laurent of William Laurent Advisors and Malcolm Chisholm of Ask Get, are in our New York studio, and then we’re going to hear from Navish Javed of InetSoft. So we’re going to hear the consultant perspective and the vendor perspective, and of course, we’ll have our exciting roundtable discussion...
Visualization and Memory-Based Data Discovery Tool - The only other mega BI vendor I want to single out there is probably SAP with MIRO. So they are trying to build out a visualization and memory-based data discovery tool called Lumira. You will probably see it at SAPPHIRE which is next week, SAP’s major conference. You will probably see Lumira focused on very heavily. Probably the biggest only concern here many people already complain that there are so many tools in the Business Objects and SAP portfolio, and there’s been some shifting focus on which tools to use in which situations. So we haven’t seen a lot of SAP Lumira adoption yet because I think the entire SAP and Business Objects installed base has been looking at Webi and Crystal and a lot of the BW tools around design studio and analysis, et cetera. So we haven’t really seen as much adoption yet of Lumira in the market. But anyway, the moral of the story is data discovery alive and well and becoming really the dominant segment of the BI space right now and this is how people are integrating, reporting, and analyzing their data...
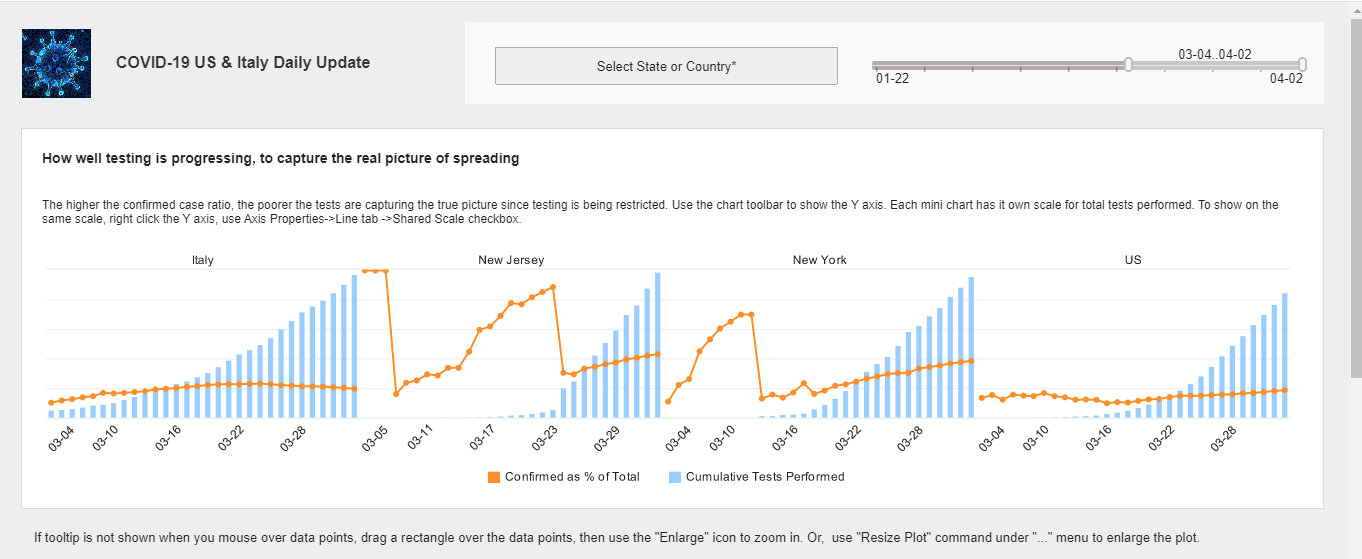
Visualize Coronavirus Infection and Test Data - Interact with this data visualization of Coronavirus infection and test data provided for free by InetSoft, a leader in data intelligence...
Visualizing Data on Google Map Charts - This page explains how you can use Google Maps in an InetSoft dashboard. By using a Google Map in your chart, you can lend a degree of realism to your geographical data, and provide important geographical context such as mountains, rivers, highways, and landmarks. In order to incorporate a Google Map in a dashboard, you must have an appropriate Google Maps Platform account. Obtain the API key from your Google Maps Platform account, and enter it in the InetSoft Enterprise Manager on the Web Map tab. Enable Use Web Map By Default to automatically use Google Maps when creating any Map Chart. Press Apply to save the settings. If you do not already have a data source with geographical data configured, begin by importing a data set into a Data Worksheet. The sample data we use here is from World Population Review which contains the top 200 US cities by population and has the structure shown below. The data set contains a lot of information about the different cities, but for this example we will just use the "pop2023" field as the measure. Create a new Dashboard based on the Data Worksheet (or other data source) you have created. To create a Google Map Chart using geographical regions such as states or cities or zip codes, add a new Chart to the Dashboard. Do not make the Chart size too large, because Google Maps have a 640px size limit imposed by Google. If the Chart component is too large, you will see a warning when you try to plot data on the map, and you will need to resize it...
Wallboarding Software: What It Is And How It Is Used - Dashboard wallboarding is the practice of displaying live dashboards on large, always‑visible screens placed in shared work environments. These screens, often mounted on walls or positioned in high‑traffic areas, continuously show real‑time metrics, alerts, and operational indicators. The purpose is to make critical information impossible to miss, ensuring that teams stay aligned, aware, and ready to act without needing to open a laptop or navigate to a reporting tool. Wallboards differ from standard dashboards in both intent and design. A typical dashboard is meant for individual exploration, filtering, and analysis. A wallboard is meant for passive viewing. It must communicate quickly, clearly, and at a distance. This means larger typography, simplified visuals, minimal interaction, and a focus on the most essential metrics. A wallboard is not a place for deep analysis. It is a place for instant situational awareness...
What Are the Advantages of a NoSQL Distributed Database? - Scalability: NoSQL databases are designed to scale out horizontally, which means they can handle a large volume of data and high traffic loads by distributing the data across multiple servers or nodes. This allows for seamless expansion as your application grows. High Performance: NoSQL databases are optimized for specific types of data models and access patterns, which can lead to faster read and write operations compared to traditional relational databases, especially for applications with high throughput requirements. Flexible Data Models: NoSQL databases support flexible data models, including document, key-value, wide-column, and graph models. This flexibility allows developers to choose the most suitable data model for their specific application requirements, enabling better schema-less data management. Schema Evolution: Unlike relational databases, which require a predefined schema, NoSQL databases allow for dynamic schema evolution. This means you can add or remove fields from your data without having to modify the entire database schema. High Availability and Fault Tolerance: NoSQL databases are designed to ensure high availability and fault tolerance. They often have built-in replication and sharding mechanisms that provide redundancy and fault tolerance in case of hardware failures or other issues...
What Are All the Ways InetSoft Supports Scaling Up to Handle Massive Data and User Numbers? - Here are several ways in which InetSoft supports scalability: Distributed Architecture: InetSoft employs a distributed architecture that allows the system to scale horizontally by adding more servers or nodes. This ensures that the load is distributed across multiple machines, preventing bottlenecks and improving overall system performance. Load Balancing: The platform supports load balancing to evenly distribute incoming user requests across multiple servers. This helps optimize resource utilization and ensures that no single server becomes a performance bottleneck, enabling efficient handling of large user numbers. In-Memory Processing: InetSoft utilizes in-memory processing techniques to accelerate data retrieval and analysis. By storing frequently accessed data in memory, the platform can quickly respond to user queries, leading to faster and more scalable performance, especially when dealing with massive datasets. Data Compression and Caching: To optimize data transfer and reduce latency, InetSoft incorporates data compression techniques. Additionally, caching mechanisms are employed to store and reuse frequently accessed data, minimizing the need for redundant processing and enhancing system responsiveness...
What Are the Benefits of OLAP and Data Warehouses? - Online Analytical Processing (OLAP) and data warehouses are essential components in the field of business intelligence and data analytics. They offer a range of benefits that help organizations manage and analyze their data effectively. Here are some of the key benefits of OLAP and data warehouses: Faster Query Performance: OLAP systems and data warehouses are designed to handle complex queries and analytical tasks efficiently. They use specialized indexing and storage structures that optimize query execution, resulting in faster response times even when dealing with large datasets. Consolidated Data: Data warehouses consolidate data from various sources across an organization into a centralized repository. This makes it easier to access and analyze data from different departments, systems, and databases in a unified manner. Historical Analysis: Data warehouses store historical data, allowing users to perform time-based analysis and identify trends and patterns over time. This is essential for making informed decisions based on historical performance and behavior. Data Quality and Consistency: Data warehouses often include data cleansing, transformation, and validation processes. This ensures that the data stored is of high quality and consistent across different sources, reducing errors and discrepancies in analyses...

What Are the Costs of Purchasing and Maintaining a Data Warehouse? - Acquiring and maintaining a data warehouse involves several costs, both upfront and ongoing. It's important to consider these expenses when planning for the implementation of a data warehouse. Keep in mind that the specific costs can vary widely depending on factors like the size of the organization, the complexity of the data infrastructure, and the chosen technology stack. Here's a comprehensive breakdown of the costs associated with a data warehouse: Hardware and Software Costs: Hardware: This includes the physical servers and storage devices needed to host the data warehouse. It can be on-premises, in the cloud, or a combination (hybrid). Software: This covers the licenses and subscriptions for the data warehouse software itself. Some popular data warehousing solutions include Amazon Redshift, Google BigQuery, Microsoft Azure SQL Data Warehouse, and Snowflake. Data Integration and ETL (Extract, Transform, Load): ETL Tools: Depending on the complexity of your data sources, you may need specialized ETL tools. These tools help in extracting data from various sources, transforming it into a usable format, and then loading it into the data warehouse...
What Are the Different Ways You Can Highlight Data Using InetSoft's Software? - Color Coding: Heat Maps: InetSoft's software provides heat maps, where colors represent values, making it easy to identify patterns and variations in data. Conditional Formatting: Users can set up rules for conditional formatting to dynamically change the appearance of data based on predefined conditions. For example, cells might change color if they meet certain criteria. Thresholds and Alerts: InetSoft allows users to define thresholds for key performance indicators (KPIs). When data exceeds or falls below these thresholds, the system could generate alerts or highlight the data for attention. Icons and Symbols: Users may have the option to use icons or symbols to visually represent specific data points or conditions, making it easier to interpret information at a glance. Data Bars and Sparklines: InetSoft's software supports data bars or sparklines to display trends or variations within a cell, providing a compact visual representation of data over a certain range. Grouping and Aggregation: The software allows users to group and aggregate data, and visual cues could be applied to these groups, helping to highlight trends or outliers in larger datasets...
What Are InetSoft's Options for Integration - Data Source Integration InetSoft supports a wide range of data sources, including databases (SQL, NoSQL), flat files, web services, and more. This allows users to seamlessly connect their BI reports and dashboards to their preferred data repositories. ETL (Extract, Transform, Load) Integration InetSoft can integrate with ETL tools like Talend, Informatica, or Microsoft SSIS. This enables organizations to perform data extraction, transformation, and loading operations before presenting the information in their BI reports. API Integration InetSoft offers APIs that allow for custom integrations with other software applications. This could include CRM systems, ERP platforms, or any other software that supports API connectivity. Embedding BI into Applications InetSoft provides the capability to embed BI components like reports, dashboards, and analytics directly into third-party applications. This is particularly useful for software vendors looking to enhance their offerings with BI capabilities...
What Are Join Types? - This article will explore the different types of joins that can be used for accessing database tables, and will explain how to implement these joins in the InetSoft application. In database theory, a join is a method of combining data from multiple tables while enforcing a constraint on the data. The nature of the constraint determines the type of join. The following sections explore the various join types and join constraints. The join of two database tables, A and B, can be thought of theoretically as comprising two steps: Form the Cartesian product (or Cross Join) of table A and table B, keeping all columns from both tables. The cross join is the combination of every row in Table A with every row in Table B, which results in a new table that has size length(A)*length(B). Remove every row that does not meet the specified join constraint. Note that from an implementation perspective, performing the above steps (in particular, forming the cross join) is not computationally efficient, and database software uses more efficient algorithms to do this. However, the steps above are useful for conveying the theoretical basis of joins, and for facilitating explanation of join types...

What Are Some Analyses That a Shipping Analyst at Ocean Freight Transportation Company Would Do? - A Shipping Analyst at an ocean freight transportation company plays a crucial role in ensuring the efficient and cost-effective movement of goods across the seas. Their responsibilities involve conducting various analyses to optimize shipping operations. Here are some key analyses that a Shipping Analyst might perform: Route Optimization Analysis: Evaluate different shipping routes to identify the most efficient and cost-effective paths. Consider factors such as distance, transit time, fuel costs, and potential risks (e.g., weather conditions, piracy). Cost-Benefit Analysis: Analyze the overall cost of shipping operations, including fuel costs, port charges, labor, and maintenance. Conduct cost-benefit analyses for different shipping methods and routes to optimize expenses. Capacity Utilization Analysis: Monitor and analyze the capacity utilization of vessels to ensure optimal use of available space. Identify opportunities to consolidate shipments and reduce empty container spaces. Market and Industry Trends Analysis: Stay informed about market trends, industry regulations, and geopolitical factors affecting global shipping. Analyze how external factors may impact shipping costs, demand, and market dynamics...
What Are Some Examples of IoT and the Data They Generate? - The Internet of Things (IoT) encompasses a wide range of interconnected devices that collect and exchange data via the internet. These devices are embedded with sensors, actuators, and connectivity features that enable them to gather information from their surroundings and communicate with other devices or systems. Here are some examples of IoT devices and the types of data they generate: Smart Home Devices: Smart Thermostats: These devices monitor temperature and humidity levels within homes and adjust heating or cooling systems accordingly. They generate data on temperature settings, occupancy patterns, and energy usage. Smart Lighting Systems: IoT-enabled light bulbs and switches can be controlled remotely and may include features such as motion detection and dimming capabilities. They collect data on lighting preferences, usage patterns, and energy consumption. Smart Security Cameras: These cameras capture video footage of homes or premises and may include features such as motion detection, facial recognition, and night vision. They generate data on security events, occupancy status, and suspicious activities. Wearable Health Monitors: Fitness Trackers: Devices like smartwatches and fitness bands monitor users' physical activity, heart rate, sleep patterns, and other biometric data. They generate data on exercise routines, health metrics, and sleep quality. Medical Sensors: IoT-enabled medical devices, such as glucose monitors and blood pressure monitors, collect real-time health data and transmit it to healthcare providers for remote monitoring and analysis. They generate data on vital signs, medication adherence, and disease management...
What Are the Types of Multidimensional Data? - Data with several dimensions or properties is referred to as multidimensional data. To comprehend complicated systems and events better, it is often utilized in data analysis, machine learning, and data visualization. We shall talk about numerous multidimensional data types and their uses in various domains in this post. Multidimensional Data Types and Categories Space Data Data with a geographic or geographical component is referred to as spatial data. It may include details on the position, size, and dimensions of objects, as well as the separation and direction between them. Satellite photography, topography maps, and GPS coordinates are a few examples of spatial data...
What Big Data Reporting Tools Are There? - What Big Data reporting tools are there? If we have all this data, and we need to do analytics on it. What reporting tools can we use to get the stuff back out? Can we use SSRS which is SQL Server Reporting Services? The short answer to that one is yes. The key to all of these, and I want to put a big asterisks on this, because these is the approach we’re going to use today. I really think it’s kind of a stop gap measure, and it’s going to change, but I mention thing called Hive that in effect creates a SQL abstraction layer over Hadoop. And what Microsoft has done is to create an ODBC driver for Hive, so in effect any ODBC client can talk to Hadoop via this ODBC driver, and the Hive layer over Hadoop, that includes reporting services. That includes knowledge integration services. It includes only the new tabular mode of analysis services. The original multidimensional mode of analysis services actually wouldn’t really work with ODBC. It’ll only it only work with only the Big Data sources. I didn’t even know that until I tried to get it to work against Hadoop, and I discovered that. And powerview, which is Microsoft’s new analysis and data visualization product, that is part of SQL Server, and it runs inside of Share Point...
What Data Sources Do Care Coordination Data Analysts Mash Up? - Care coordination data analysts rely on a variety of data sources to gain comprehensive insights into patient care, healthcare processes, and overall system efficiency. Mashup, in this context, refers to the integration and analysis of diverse datasets from multiple sources. Here are some key data sources that care coordination data analysts typically mash up: Electronic Health Records (EHRs): Patient medical history, diagnoses, medications, and treatment plans are crucial for understanding individual patient needs. Integration of EHR data provides a comprehensive view of a patient's healthcare journey across different care settings. Claims and Billing Data: Claims data from insurance providers contains information on medical procedures, services rendered, and associated costs. Analyzing billing data helps in understanding the financial aspects of healthcare services and optimizing reimbursement processes. Health Information Exchanges (HIEs): HIEs facilitate the sharing of patient information across different healthcare organizations...
What Data Sources Would a Data Analyst at a Toy Manufacturer Mash Up? - A data analyst at a toy manufacturer would likely mash up data from various sources to gain comprehensive insights into different aspects of the business and the market. Some potential data sources that a data analyst at a toy manufacturer might mash up include: Sales Data: Sales data from internal systems would provide valuable information about which toys are selling well, trends over time, and regional variations in sales. This data could include information such as product SKUs, sales quantities, revenue, and customer demographics. Inventory Data: Inventory data would allow the analyst to understand stock levels, turnover rates, and potential supply chain bottlenecks. By combining sales data with inventory data, the analyst could identify which toys are in high demand and ensure that sufficient stock is available to meet customer demand...
What Do Analysts in the Biologics Industry Do Data Mining On? - Analysts in the biologics industry engage in data mining on a diverse range of critical aspects to extract valuable insights that inform decision-making and optimize various processes within the sector. Biologics, which include a wide range of biological products such as vaccines, antibodies, and gene therapies, involve complex processes and extensive data. Analysts leverage data mining techniques to uncover patterns, trends, and relationships within this data. Here are key areas that analysts in the biologics industry typically focus on: Bioprocess Optimization: Data mining is applied to optimize the bioprocessing stages, including cell culture, fermentation, and purification. Analysts extract insights to enhance yield, reduce production costs, and improve overall efficiency in the manufacturing of biologics. Quality Control and Assurance: Analyzing data related to product quality to ensure that biologics meet stringent regulatory standards. Identifying patterns in quality control data to maintain consistency and adherence to Good Manufacturing Practices (GMP). Clinical Trials Data: Mining data from clinical trials to assess the safety and efficacy of biologic products. Extracting insights related to patient responses, adverse events, and other clinical outcomes...
What Does an Analyst at a Dietary Supplement Manufacturer Create Reports About? - An analyst at a dietary supplement manufacturer plays a crucial role in gathering, analyzing, and interpreting data to support informed decision-making within the company. The reports created by such an analyst cover a range of aspects critical to the success and compliance of the dietary supplement manufacturing process. Here are key areas that an analyst at a dietary supplement manufacturer may create reports about: Quality Control and Assurance: Monitoring and reporting on the quality control processes throughout the manufacturing cycle. Analyzing data related to product quality, ensuring compliance with regulatory standards and internal quality assurance protocols. Production Efficiency: Creating reports on production efficiency, including batch processing times, resource utilization, and overall manufacturing effectiveness. Identifying areas for improvement in production processes to enhance efficiency and reduce costs. Inventory Management: Generating reports on inventory levels of raw materials, packaging materials, and finished products. Analyzing inventory turnover rates and providing insights to optimize stock levels and reduce waste. Supplier Performance: Analyzing data related to supplier performance, including the quality of raw materials and timely deliveries. Creating reports to assess and monitor the reliability and consistency of suppliers...
What Happened to Adobe Flash? - Adobe Flash was a multimedia software platform that was widely used for creating animations, games, and interactive content on the internet. It was once a dominant force in web development, particularly in the early 2000s. However, over time, a combination of factors led to the decline and eventual discontinuation of Adobe Flash. Security Vulnerabilities: Flash was notorious for its security vulnerabilities. It was a common target for hackers, and numerous exploits were discovered over the years. This led to a significant number of security updates and patches being released by Adobe. Performance Issues: Flash was known for being resource-intensive. It could slow down computers, drain battery life on laptops, and cause browsers to crash. This was a significant drawback in an era when performance optimization was becoming increasingly important. Mobile Incompatibility: Flash was not supported on mobile devices, most notably Apple's iOS devices. This created a significant gap in the user experience, as an increasing number of people began accessing the internet primarily through smartphones and tablets. Emergence of HTML5: HTML5, a newer web standard, started gaining traction. It offered many of the same capabilities as Flash, including multimedia and interactivity, but without the need for a separate plugin. This made it more accessible, efficient, and secure...
What Is a Cloud-native Microservice Architecture? - Cloud-native microservice architecture is an approach to designing, building, and deploying applications that leverages cloud computing principles and is based on the microservices architectural style. This combination enables applications to be highly scalable, resilient, and portable, making them well-suited for dynamic, distributed environments such as public, private, and hybrid clouds. Here's a breakdown of its key components and features: 1. Cloud-Native Principles Cloud-native refers to applications specifically designed to take advantage of cloud computing's scalability, elasticity, and resilience. Characteristics include: Containerization: Applications are packaged into lightweight, standalone containers (e.g., using Docker) that are portable across environments. Dynamic orchestration: Platforms like Kubernetes automate the deployment, scaling, and management of these containers. DevOps practices: Continuous Integration and Continuous Delivery (CI/CD) pipelines enable fast and reliable software updates. Resilience: Applications are designed to handle failures gracefully, often using patterns like circuit breakers or retries. 2. Microservices Architectural Style Microservices architecture breaks applications into small, independent, and loosely coupled services that perform specific business functions. Each microservice...
What Is Co-Hosting, and What Are Its Benefits? - Co-hosting a Business Intelligence (BI) application and data sources involves the simultaneous hosting or deployment of both the BI software and the underlying data sources in a shared environment. This arrangement is characterized by the integration of the BI application with the data sources, allowing for seamless data access, analysis, and reporting. Here are key aspects and considerations associated with co-hosting a BI application and data sources: Shared Infrastructure: Definition: Co-hosting typically involves deploying both the BI application and relevant data sources on the same infrastructure, whether it's on-premises servers or cloud-based platforms. Benefits: Shared infrastructure can lead to better performance optimization, efficient resource utilization, and simplified management. Unified Access to Data: Definition: Co-hosting ensures that the BI application has direct and unified access to the data sources it needs to analyze and present information. Benefits: Streamlined data access facilitates real-time reporting, reduces latency, and supports comprehensive analytics without the need for extensive data transfer. Integrated Data Processing: Definition: Data processing tasks, such as ETL (Extract, Transform, Load) operations, may be performed within the same hosting environment to prepare and transform data for analysis. Benefits: Integration of data processing with the BI application can enhance efficiency, simplify data workflows, and support the delivery of timely insights...
What Is Data Architecture as a Service? - Data governance might be hard to execute in a decentralized company. During the Enterprise Data World conference, two primary methodologies were presented: top-down and peer-based. Peer-based efforts, on the other hand, were shown to be more successful in decentralized companies, while top-down techniques were mostly beneficial in centralized organizations with a specific emphasis. Data Architecture as a Service (DAaaS) The authors suggest using a technique called Data Architecture as a Service to handle the issue of data governance in a decentralized organization (DAaaS). The hype around Software as a Service (SaaS) and Platform as a Service (PaaS) is combined with peer-based data architecture ideas in DAaaS. (PaaS). The authors aim to make it appear as if they are providing their customers with a valuable service while carrying out data architecture chores that are typically carried out via governance...

What Is a Data Lakehouse and What Are Its Benefits? - The advent of the data lakehouse has revolutionized the way corporations handle their data, allowing for a more efficient and comprehensive approach. This contemporary design combines data lakes with data warehouses to provide a single data repository with unmatched flexibility, cost-efficiency, and sophisticated analytics. We will go into the idea of a data lakehouse and examine its many advantages in this article. The data lakehouse's function as a centralized data store is at its core. A data lakehouse, in contrast to conventional compartmentalized techniques, gathers all of an organization's data, both organized and unstructured, into one readily accessible area. This centralization facilitates a more streamlined and effective data management process by making it easier to obtain and analyze data from many sources. Organizations may have a thorough understanding of their information environment and make better decisions by dismantling data silos. The ability of a data lakehouse to handle both organized and unstructured data is one of its most notable properties. Conventional data warehouses are great at handling structured data, but they often have trouble handling the unstructured data that's prevalent in today's data environment. On the other hand, a data lakehouse carries over the adaptability of data lakes, enabling businesses to easily store and handle unstructured data. Strategic coupling within a wider data storage and management system allows firms to get insights from a variety of data kinds, enabling innovation and adaptation to changing business needs...
What Is Data Friction? - Any impediments or inefficiencies that prevent a company's data from flowing freely are referred to as data friction. Technical problems like mismatched systems, poor data quality, or ineffective data management techniques like manual data input, a lack of automation, or insufficient data storage and retrieval techniques are just a few examples of the many various ways that these barriers might appear. Organizational impediments, such as siloed data, when data is divided into many departments or systems and is challenging to access and exchange, may also cause data friction. Making strategic choices based on the whole picture might be difficult without a full perspective of the organization's data. Businesses may have severe effects from data friction, including lost opportunities, wasted time and resources, increased risk of data breaches or compliance violations, and poor decision-making as a result of erroneous or incomplete data...
What Is Data Mesh Architecture? - Big data is expanding at a never-before-seen pace, and with it come the problems of data silos and data governance. A new method of data architecture is required since conventional methods often fail to address these issues. Enter data mesh architecture, a cutting-edge method of data architecture created to deal with the problems of data silos and data governance. The definition, guiding principles, advantages, and implementation of data mesh architecture will all be covered in this article. A new method of data architecture called data mesh architecture places an emphasis on decentralizing data ownership and management. Data ownership and administration are centralized in conventional methods to data architecture, which means that a single team is in charge of gathering, storing, and managing data. This often results in data silos, where several teams or departments within an organization each have their own data, making it difficult to access and utilize the data efficiently. Data mesh design, on the other hand, encourages decentralized data ownership and management by enabling individual teams to oversee their own data domains...
What Is a Data Pipeline? - A data pipeline is a series of processes that move data from one system or source to another while transforming, enriching, or preparing it for analysis, storage, or operational use. It acts as the backbone of modern data engineering, enabling organizations to handle the increasing volumes and complexity of data efficiently. Key Components of a Data Pipeline: Data Sources: The starting point for any pipeline. These could be databases, APIs, IoT devices, log files, streaming platforms, or other systems that generate or store data. Ingestion: The process of collecting data from sources and bringing it into the pipeline. This could happen in batch mode (e.g., scheduled data transfers) or real-time/streaming mode (e.g., continuous data flow). Transformation: Data is often not ready for use in its raw form. Transformation involves cleaning, aggregating, filtering, standardizing, or enriching data to make it usable. Common frameworks for this include ETL (Extract, Transform, Load) and ELT (Extract, Load, Transform). Storage: Once processed, data is stored for analysis or future use. This could be in data warehouses, data lakes, or specialized storage systems optimized for fast querying and retrieval...
What Data Governance Success Looks Like - When we talk about what data governance success looks like, what it looks like is making sure that the policies that come down from this data governance process are actually executed in a regular and sustainable way. And that can look like anything from making data quality more robust, to making sure that metadata is formalized, to enacting data privacy and security logging within the data itself. So data stewardship is really the act of aligning the policies from data governance with the execution of data management, and tracking all of that data across its supply chain with the company. What does success look like. Success looks like a closed loop between the policy making and the constant evolution of the data quality and deployment over time. What is the role of data stewardship in data governance? Data stewards for better or for worse have really become roving line backers in a lot of companies, where, you know, anything having to do with data, the data steward shows up, but we find there are two qualifiers for a successful data steward. And one of them is that he or she is somebody who understands data at either the subject area level, or even the element level enough to track it across its supply chain or its lineage in a company. A data steward really understands the systems of origin, where the data’s created, where it comes from, how it’s touched across the organization by different systems and different users, and what its life cycle looks like in a company...
What Data Sources Does an Analyst at a Chain of Fitness Centers Mash Up? - An analyst at a chain of fitness centers may mash up various data sources to gain insights into member behavior, operational performance, and overall business health. These data sources provide a comprehensive view of the business and help inform decision-making across different functional areas. Here are some common data sources that an analyst at a chain of fitness centers might mash up: Membership Data: Membership data includes information about members' demographics, membership plans, membership tenure, and membership status. By analyzing membership data, analysts can identify trends in member acquisition and retention, segment members based on demographics or behavior, and tailor marketing strategies to target specific customer segments. Attendance Data: Attendance data tracks the number of visits and participation rates at different fitness center locations and classes. By analyzing attendance patterns, analysts can identify peak hours, popular classes, and trends in member engagement. This information can help optimize facility operations, staffing levels, and class schedules to meet member demand and maximize utilization. Sales and Revenue Data: Sales and revenue data encompass revenue generated from membership fees, personal training sessions, merchandise sales, and other revenue streams. Analysts can track sales performance, revenue trends...
What Data Sources Does an Analyst at an EV Manufacturer Mash Up? - An analyst at an electric vehicle (EV) manufacturer may need to mash up data from a variety of sources to gain comprehensive insights into various aspects of the business. Here are some potential data sources an analyst might utilize: Vehicle Telemetry Data: This includes data collected from the EVs themselves, such as battery performance, driving behavior, charging patterns, and vehicle diagnostics. Telemetry data can provide insights into vehicle efficiency, reliability, and potential areas for improvement. Supply Chain Data: Analysts may gather data from suppliers regarding the sourcing of raw materials, component manufacturing, logistics, and inventory levels. Understanding the supply chain can help optimize procurement processes, identify bottlenecks, and ensure timely delivery of components. Sales and Marketing Data: Data on sales transactions, customer demographics, marketing campaigns, and customer feedback can provide insights into customer preferences, market trends, and the effectiveness of marketing efforts. This data can help optimize sales and marketing strategies and identify opportunities for product differentiation...
What Does the Concatenation Table Join Do? - In a traditional database context, a "join" operation is used to combine rows from two or more tables based on a related column between them. The most common types of joins are: Inner Join: This returns only the rows that have matching values in both tables. Left Join (or Left Outer Join): This returns all the rows from the left table and the matched rows from the right table. The result will contain NULL in places where there is no match. Right Join (or Right Outer Join): This returns all the rows from the right table and the matched rows from the left table. Similar to the left join, it fills in NULL where there is no match...
What Is Agile Development? - Agile development is a method of software development that emphasizes flexibility, collaboration, and customer satisfaction. The Agile methodology is based on the Agile Manifesto, a set of guiding values and principles for Agile software development. The Agile Manifesto states that individuals and interactions are more important than processes and tools, that working software is more important than comprehensive documentation, and that customer collaboration is more important than contract negotiation. One of the key principles of Agile development is the use of short development cycles, called sprints, which typically last between one and four weeks. During each sprint, a team works to deliver a potentially shippable product increment. This approach allows for rapid delivery of working software, which can then be tested and refined based on customer feedback. Another important aspect of Agile development is the use of cross-functional teams. In an Agile team, all members are responsible for the success of the project, and each team member brings their own unique skills and expertise to the table. This helps to ensure that all necessary skills are represented on the team, and that the team can work together effectively to deliver a high-quality product...
What Is a Cloud Flexible Solution? - A business intelligence solution that delivers the benefit of cloud computing and software-as-a-service while giving you the maximum level of control. - A solution that is designed and optimized for cloud computing and software-as-a-service where software and data are increasingly distributed between cloud-based and in-house applications. - A solution that allows highly flexible options for embedding and rebranding regardless of InetSoft-hosting, self-hosting, hybrid-cloud, or on-premise deployment. - A solution that is expressly designed to be embedded, whether inside an enterprise portal or another solution provider's cloud-based solution...
What Is a Data Mashup Tool - So what is a data mashup tool? First of all, what you see in front, it looks like an Excel spreadsheet, but it has nothing to do with Excel, it's just a grid. How do I access my data? I select my query node, and I see a list of all my data sources. A data source could be a relational database like Oracle, SQL Server, or DB2. It could be a flat file. It could be a Web service. It could be an XML file, or even be another API. So we are very flexible in terms of the kind of data we can access. We can access almost any kind of data. I choose my data source. Now how would you expose the data to your developers, to your file users? You have two options, option one, you can create one or more predefined queries, you can just drag and drop fields for the basis of the visualization. Now the problem with query is that it's a fixed result set, so it's hard to envision every possible used case, every possible requirement upfront. So you may end up creating a large bunch of queries, and you may still have this back and forth process between your business team and your IT team, so instead of building all these queries, you can replace them with single, more flexible data model, or as you said the partition. The data model is not a query, it's a mapping, it's a logical layer, it's a business layer...
What Is Data Mining? - What is data mining? Data mining means search for hidden information. The locating of previously unknown patterns and relationships within data, using a business intelligence application, is called data mining. For example, it could be the locating of customers with a common interest in a retail establishments' database. Through a variety of techniques, data mining identifies nuggets of information in bodies of data. Data mining extracts information in such a way that it can be used in areas such as decision support, prediction, forecast and estimation. The data is often voluminous but of low value and with little direct usefulness in its raw form. It is the hidden information in the data that has value. In data mining, success comes from combining your knowledge of the data, with advanced active analysis techniques in which the computer identifies the underlying relationships and features in the data. The process of data mining generates models from historical data that are later used for prediction, pattern detection and more. The technique for building these models is called machine learning or modeling...
What Is a Data Mapping Tool? - You must have heard the phrase "form follows function." Most people know that the first step in software engineering is to create a user interface (UI) for your application. The UI consists of controls, panels, gadgets, etc. For people to seamlessly use your work product, you should make it easy to understand where they can find various widgets and controls. A data mapping tool can automate this process by enabling you to quickly design a user interface that follows the data architecture. Without an intelligent framework such as a data mapping tool, designing a flexible and responsive UI can be tricky and time-consuming. Read on to learn more about data mapping tools. Data mapping is a process that enables you to transform an unstructured data set into a structured one. This data transformation may be required based on the type of query you want to perform on it. For example, you might want to create a report or generate data for a specific business process. Mapping is an integral part of any database development project because it can help improve the performance and usability of your application. Mapping allows you to use your existing database tables to create reports and dashboards that are impossible with traditional database queries...
What Is Data Product Management? - Data product management is a lot like making the perfect pizza. You want it to be delicious, but you also want to be efficient with your ingredients. This can be tricky when dealing with large data sets and tons of customer data. However, if you use these best practices from data product management, you will be able to enjoy a tasty pie in no time. What Is Data Product Management? Data product management is the process of creating, managing, and optimizing data products. Data products are a combination of data and analytics that can be used to make business decisions. A data product may be a report, presentation, or dashboard. Various departments in an organization create data products, including sales, marketing, HR, finance, and operations. Data product managers are responsible for coordinating these teams to create and manage their data products. They must have strong technical skills in both programming languages, such as Python or R and SQL, and be able to write well-crafted reports. They should also be able to work closely with other departments to ensure that the information is accurate and relevant for their users...
What Is a Database Field and What Are the Types? - A database is a set of data arranged in a particular way so that a computer program can use the necessary parts from it. Every database has several fields, records, and files. A database field refers to a set of values arranged in a table and has the same data type. A field is also known as a column or attribute. It is not necessary for the values included in a field to be in the form of text alone, as this is not a requirement. Some databases have the capability of having fields that contain images, files, and other types of media, while others have the capability of having data that links to other files that can be accessed by clicking on the field data. example of database fields in a table More Dashboard Examples In every database system, you can find three modes of fields. They are: Required Calculated Optional...
What is a Database Schema? - A database schema is the table structure of a database, independent of the data it contains. Database theory offers a mathematical description of database schemas, but from a practical perspective a schema specifies the table names, number of columns in each table, column names, and data types. The schema fully specifies the scope of data that can be read or written to the database, but does not include any data. The schema also specifies the certain columns are special 'key' columns for purposes of relating data. For example, the SALES_EMPLOYEES table below has a primary key column called EMPLOYEE_ID. This is the unique employee identifier. When this column appears within other tables, such as ORDERS, it is called a foreign key. A foreign key is simply a primary key from a different table...
What Is the Difference Between a Measure and a Metric? - Metrics and measures are frequently used interchangeably. They are frequently mistaken with one another and presented as the same item. It is easy to mix the two since, in some ways, a metric is a kind of measure, although a more useful and informative measure. While a measure is a basic number - for instance, how many kilometers you have drivenâ€"a metric contextualizes that measure - how many kilometers you have traveled per hour. This added information increases the usefulness of the same statistic by several orders of magnitude, particularly when looking at commercial KPIs. Conversions per thousand impressions are an illustration of a vital metric for an internet business. Understanding you have twenty conversions is a restricted measure in and of itself. A really positive KPI is knowing that those twenty conversions came from a hundred impressions. It is less beneficial if they came from a thousand impressions - context is crucial...
What Is the Difference Between Web Based and Cloud Based? - Web-based and cloud-based are two terms that are often used interchangeably, but they refer to different types of technology. Web-based refers to any application or software that is accessed through a web browser over the internet. These applications are hosted on a web server and can be accessed from any device with internet access and a web browser. Examples of web-based applications include Google Docs, Salesforce, and Trello. Cloud-based, on the other hand, refers to software and services that are hosted on remote servers, often referred to as the "cloud." These services can also be accessed over the internet, but they are not limited to web browsers. Cloud-based services can include software as a service (SaaS), infrastructure as a service (IaaS), and platform as a service (PaaS). Examples of cloud-based services include Amazon Web Services, Microsoft Azure, and Google Cloud Platform. One key difference between web-based and cloud-based is that web-based applications are typically designed for specific tasks, such as word processing or project management. Cloud-based services, on the other hand, provide the infrastructure and tools for organizations to build and run their own applications...
What Is Digital Business Observability? - The capacity of a company to acquire insight into the performance of its digital operations in real-time is referred to as "digital business observability." This implies that companies may continually monitor their digital systems, apps, and networks to find faults, solve difficulties, and find chances for improvement. Organizations may use observability to make data-driven choices that foster innovation, enhance the customer experience, and boost revenue. This article will explore the idea of "digital business observability," why it's important, and how businesses may use it to improve their online operations. Monitoring and analyzing the behavior of digital systems in order to find problems that affect performance, user experience, and business consequences is known as "digital business observability." This entails monitoring the behavior of software, networks, physical systems, and other digital assets to spot possible bottlenecks, flaws, and optimization possibilities. The objective of observability is to provide insight into intricate digital systems, which is essential for resolving problems, seeing trends, and coming to informed conclusions...
What Is Executional Agility? - Now let’s talk about executional agility. Nowadays you have to be able to deliver a new service in weeks, not months, because within two weeks all your competitors are going to offer the same thing. When you’re taking a look at marketing campaigns, you need a better understanding of customer buying behavior. Does it take you 5 or 6 months to get those insights disseminated, or can you quickly get those into your organization? That is the flexibility and agility that you need to build in. You have to start taking a very strong focus around processes and understanding of your customers. Through a focus around process, you can find what drives innovation and thereby continuously stay ahead of the competition. You need to drive agility. Agility is more than a term. You can quantify the benefits of this focus around agility, and you can see the return on your investment. It’s as much around driving the revenue growth as it is profitability. There is also a benefit in terms of resource utilization. A higher return on capital, as well as a more consistent return, are goals. In this case you are serving to lower valuation volatility. The result is your business can better anticipate changes as well as can better respond to those changes going forward. You have to make sure that as you focus on agility, you focus on the integrity of the process. Consistently manage those customer expectations. Build in operational dexterity...

What Is Governed Data Integration? - Data integration is a complex process that involves combining data from different sources into a single, unified view. This process is essential for many organizations to gain insights and make informed decisions. However, the process of data integration can also be quite challenging, especially when it comes to ensuring that the data being integrated is accurate, consistent, and secure. In recent years, there has been a growing emphasis on the concept of "governed" data integration. This refers to the use of specific policies and procedures to ensure that data integration is done in a controlled and systematic way. The goal of governed data integration is to ensure that the resulting data is accurate, consistent, and secure, while also complying with legal and regulatory requirements. While governed data integration may seem straightforward, it can actually be quite complex. There are many factors to consider, including data quality, security, and privacy. In addition, there may be legal or regulatory requirements that must be taken into account...
What Is Graph Data Science? - The study of intricate interconnections and interactions between data pieces is the focus of the quickly expanding area known as "graph data science." To make sense of massive, interconnected datasets, it makes use of graph databases, graph algorithms, and machine learning techniques. This article will examine what Graph Data Science is, how it functions, and the many sectors in which it is used. A branch of data science called data science focuses on the analysis of data presented as graphs. A graph is a type of mathematical structure made up of a set of nodes (also known as vertices) and a set of connecting edges. Each edge depicts a connection or relationship between two nodes.Numerous types of data, such as social networks, transportation networks, biological networks, and others, can be represented using graphs. To glean insights from such data, graph algorithms and machine learning methods are used in graph data science...
What Is The Purpose of Asset Operations? - The purpose of Asset Operations is to effectively manage and optimize the performance, maintenance, and utilization of physical assets within an organization. Asset Operations involves the day-to-day activities and processes related to operating, maintaining, and supporting the lifecycle of assets to ensure their optimal functionality, reliability, and efficiency. Here are some key purposes of Asset Operations: Maximize Asset Performance: The primary goal of Asset Operations is to maximize the performance and output of assets. This involves ensuring that assets are functioning at their peak efficiency, delivering the expected level of productivity or service, and meeting operational requirements. Optimize Asset Utilization: Asset Operations aims to maximize the utilization of assets to achieve the highest possible return on investment. This involves effectively scheduling and allocating assets, minimizing downtime, and ensuring they are utilized to their full potential. Ensure Asset Reliability: Asset Operations focuses on ensuring the reliability and availability of assets. This includes implementing preventive maintenance strategies, monitoring asset health, and minimizing unplanned downtime through timely repairs and maintenance. Enhance Safety and Compliance: Asset Operations plays a crucial role in maintaining a safe and compliant working environment. It involves adhering to safety regulations, conducting regular inspections, implementing maintenance practices, and addressing potential hazards or risks associated with asset operations...
What Kind of Data Analyses Do Chemical Manufacturing Companies Do? - Chemical manufacturing companies engage in a wide range of data analyses to optimize their processes, ensure product quality, manage resources efficiently, and make informed business decisions. Here are several types of data analyses commonly performed in the chemical manufacturing industry: Process Optimization: Statistical Process Control (SPC): Monitors and controls manufacturing processes by analyzing data in real-time, ensuring that variations stay within acceptable limits. Six Sigma Analysis: Aims to minimize defects and variations in production processes to improve efficiency and quality. Quality Control: Chemical Analysis: Involves the use of analytical techniques to verify the composition and purity of raw materials, intermediates, and final products. Quality Assurance (QA): Analyzing data to ensure that products meet specified quality standards and regulatory requirements. Supply Chain Management: Demand Forecasting: Uses historical data and predictive analytics to estimate future product demand, helping companies optimize inventory levels. Logistics Optimization: Analyzing transportation and distribution data to enhance efficiency in the supply chain. Energy Management: Energy Consumption Analysis: Identifying areas of high energy consumption and implementing measures to reduce energy usage, which can lead to cost savings and environmental benefits...
When to Choose InetSoft Over Dataiku - Organizations evaluating analytics platforms often compare InetSoft and Dataiku because both support data-driven decision-making. However, they are built for different primary use cases. InetSoft is fundamentally a business intelligence and data integration platform with strong dashboarding, reporting, and governed self-service capabilities, while Dataiku is primarily a data science and machine learning workbench. Choosing the right solution depends on your goals, users, architecture, and speed-to-value requirements. 1. Choose InetSoft When Your Primary Need Is Business Intelligence and Dashboards...
What Kinds of Data Transformation Can Be Done with InetSoft's Data Mashup Engine? - Some of the key data transformation tasks that can be performed using InetSoft's Data Mashup Engine include: Data Integration: The Data Mashup Engine allows users to integrate data from disparate sources, including databases, spreadsheets, web services, and cloud-based applications. Users can easily connect to these data sources and consolidate data into a unified dataset for analysis and reporting. Data Cleansing and Quality Assurance: InetSoft's Data Mashup Engine provides tools for cleansing and standardizing data to ensure accuracy and consistency. Users can perform tasks such as removing duplicate records, correcting errors, and validating data against predefined rules to improve data quality. Data Aggregation and Summarization: Users can aggregate and summarize data using the Data Mashup Engine to create meaningful insights and reports. This includes tasks such as calculating totals, averages, and other summary statistics, as well as grouping data into categories for analysis...
What Makes ETL Processes Brittle? - ETL (Extract, Transform, Load) processes can become brittle due to various factors, leading to potential failures, errors, or inefficiencies in data integration workflows. Several key factors contribute to the brittleness of ETL processes: Data Source Changes: ETL processes are often designed to extract data from multiple source systems, such as databases, files, APIs, or streaming platforms. When the structure, format, or schema of these source systems change, it can disrupt the ETL process, leading to errors or data inconsistencies. For example, changes in column names, data types, or data formats can cause ETL jobs to fail or produce incorrect results if not properly handled. Schema Evolution: Over time, the schema or structure of the target data warehouse or data lake may evolve to accommodate new data requirements, business rules, or analytical needs. Changes in the target schema, such as adding new columns, modifying existing tables, or altering data types, can impact the ETL process and require corresponding adjustments to data mappings, transformations, and loading logic. Data Quality Issues: ETL processes rely on the assumption of data quality and integrity in the source data. However, data quality issues such as missing values, duplicates, outliers, or inconsistencies can introduce errors or anomalies into the ETL pipeline. Poor data quality can lead to data transformation errors, inaccurate results, or unexpected behavior in downstream applications or reports...
Which KPIs Are Most Likely To Be a Vanity Metric? - There's a saying that your vanity metrics should be "all things to all people." This is true, but only up to a point. Sure, it's great to have analytics that everyone can use and are "user-friendly," but you also need to ensure they're metrics that can impact the business. Suppose you can't figure out which KPIs are most likely vanity metrics. In that case, it's time to stop doing them and start focusing on things like revenues and net new clients. These two will get your business more sales leads and clients better than any other existing metric. What Are Vanity Metrics? Vanity metrics are a type of metric that are not directly related to the core business. For instance, some companies track the number of likes on their Facebook page or the number of followers on Twitter. These metrics may be important to the company, but they don't really help them grow their business. The term "vanity metric" was coined by marketing expert Seth Godin in his book Linchpin: Are You Indispensable? The term is used because it sounds like something that's important only to you and not your customers...
Which Technologies Combine to Make Data a Critical Organizational Asset? - What has made customer data so crucial to modern businesses is a combination of two technologies. The first technology is content customization, the ability to adapt content and advertising to the individual customer. This is easiest to appreciate in the context of digital delivery of videos and other media, where content and ads are tailored to the individual viewer. But the development of content customization has penetrated less conspicuous areas also, such as the coupons delivered to customers at supermarket check-out, political fundraising emails, music playlists, financial service offers, cell phone plans, and so on...
Who Uses Data Reporting Tools? - Data reporting tools are used by a wide variety of individuals and organizations across industries. Some common users of data reporting tools include: Business analysts: They use data reporting tools to analyze business data and make informed decisions. Marketers: They use data reporting tools to analyze marketing campaigns and measure their effectiveness. Sales professionals: They use data reporting tools to track sales performance and identify areas for improvement. Financial analysts: They use data reporting tools to analyze financial data and make investment recommendations. Executives: They use data reporting tools to monitor organizational performance and make strategic decisions. Researchers: They use data reporting tools to analyze data collected during research studies. Data scientists: They use data reporting tools to explore, analyze and visualize large amounts of data to extract insights. Healthcare professionals: They use data reporting tools to track patient health data and improve patient outcomes. Government agencies: They use data reporting tools to track and report on key metrics related to their programs and services. Non-profit organizations: They use data reporting tools to track donations, monitor program effectiveness and report to donors and funders...
Why Big Data Analytics Is So Important In Government - Today we’re going to talk about why big data analytics is so important in government globally, and especially in this economy. Commercial industry has been using data. The FedEx’s, the Wal-Mart’s, companies are really taking advantage of using their data, viewing it as an asset, making better decisions, faster decisions, and responding to shifts in the marketplace. Certainly in today’s environment the government is very interested in trying to do those same things. Budgets are shrinking. There are shortfalls in revenue. They just have to get smarter and better at what their doing. The Obama administration is out there promoting transparency, promoting visibility into what the government does, how they spend their money, the decisions they are making, and passing to on to every single citizen. So what they are doing today to put that in front, increase that visibility, make better decisions around policy, understand the direction of the country, itself, is very critical. In terms of where in the government the move towards better analytics is taking place, it’s in the financial departments of the various agencies. They are leading the way in terms of increasing that visibility of spending levels. Also, with healthcare reform, there is interest in knowing what is happening with costs and the aging population...
Why Choose InetSoft as an Alternative to DataDog? - DataDog excels at real-time infrastructure and application monitoring, but many teams find it overkill and expensive when the primary goal shifts to business intelligence, interactive dashboards, scheduled reports, and self-service data exploration. InetSoft provides a focused BI solution with deep data mashup capabilities, pixel-perfect reporting, and enterprise-grade visualization. Organizations replace or supplement DataDog dashboards with InetSoft for faster insights, lower costs, and broader user adoption. InetSoft combines powerful BI dashboards, true data mashup, and enterprise reporting at a fraction of DataDog's cost—perfect for teams prioritizing business intelligence over infrastructure monitoring...
Why Choose InetSoft as an Alternative to Datameer? - When evaluating modern business intelligence and data analytics platforms, organizations often face a choice between tools like Datameer — known for data preparation and analytics on big data — and more traditional BI/reporting engines like InetSoft. While Datameer has strengths, there are compelling reasons why many companies prefer InetSoft’s platform — especially when support, usability, flexibility, total cost, and real-world performance matter. In contrast, InetSoft provides a full spectrum BI solution that includes dashboards, interactive reporting, visualization, and reporting automation in a unified platform. Users can build both high-level summaries and detailed operational reports from the same engine, with tools for data mashup, transformation, and interactive analysis. InetSoft Customer Comment “Each application is data-rich, and our customers need easy-to-use, yet powerful reporting and analysis capabilities. Reports run in seconds, not minutes...
Why Choose InetSoft as an Alternative to Kyvos - When you are evaluating modern analytics platforms, it is easy to get lost in buzzwords like “semantic layer,” “AI-powered analytics,” and “cloud-scale OLAP.” Kyvos positions itself as a semantic layer for AI and BI, focused on delivering a unified view of enterprise data and fast analytics at scale. InetSoft, by contrast, is a mature, full-stack business intelligence and reporting platform that combines visual analytics, interactive dashboards, and pixel-perfect reporting in a single, cohesive solution. InetSoft If you are looking for a practical, flexible, and cost-effective alternative to Kyvos, InetSoft deserves serious consideration. Kyvos is excellent at being a semantic layer: it standardizes metrics, definitions, and business logic so that multiple BI tools can consume governed data consistently. However, that also means you still need separate tools for dashboarding, reporting, and visualization, plus the integration work to connect them all...
Why Choose Open Source StyleBI Over PostHog? - Organizations evaluating analytics platforms often compare application analytics tools with broader business intelligence solutions. Both can deliver insights, but they address different needs. PostHog focuses heavily on product analytics, event tracking, and behavioral monitoring within applications. Open source StyleBI, on the other hand, provides a comprehensive business intelligence platform designed to transform data from many systems into dashboards, reports, and self-service analytics. Choosing the right platform depends on the scope of analytics required. When organizations need unified reporting across departments, flexible data mashups, interactive dashboards, and open architecture, StyleBI offers significant advantages. Its open source foundation, broad data integration capabilities, and visual analytics environment make it a strong alternative for teams that require more than product usage tracking...
Why Effective Data Management Matters -Today, the global analytics market is worth $274 billion-an astonishing figure to say the least. With 44 zettabytes of data (and counting) currently active in the digital universe, 43% of top IT decision-makers are concerned that their current infrastructure won't be able to meet future data demands. Without an effective data management solution, your business will drown in data. While you will have access to information linked to every conceivable business department or function, wading through the data to extract actionable insights that will push your business forward will sap your time and drain your budget...
Why an ETL Process Can Become Very Slow - There are several things you can often point to which are the originators of the problems. One of them, and I will just lay it straight out there, is poorly written software. The process runs slowly, and they just assume because it runs slowly it must be the hardware that's the problem, and so they go out and write bigger checks for bigger hardware and hope to get around the problem that way. They assume that it just can't run any faster or can't be made to run any faster. The other one very often originates earlier in the whole process where they really didn't understand what was in the data or the quality or reliability of the data. And some what they think of is normal starts to creep in over time and potentially hijack the ETL processes in a non expected way, but that really they just didn't see as bad at the beginning...
Why You Need Data Discovery Software - Welcome to our webinar today. I’m looking for to talking about this topic today because I think we’re at the cutting edge of a lot of what’s going on in the BI landscape today. Let me shift to my agenda here to show what I am talking about today. So what I want to do is set the scene a little bit with some trends and objectives and just talk about what's going in the BI landscape and what I see as business drivers for change in BI. And then we’ll talk a little bit more about data discovery and unified information access, some definitions and descriptions so you can see where we’re going with that. There was a report on data discovery and UIA recently so I will enumerate some of the issues that came up in that. So I think you know this current observation. Probably no one would dispute this, but I think one of the big things going on in BI and analytics right now is the idea that we’re moving from a time when the focus has been on getting the data in and storing the data. Certainly all those issues are very important, and we could devote many, many webinars to those issues, but really I think most organizations are focused on getting information into the workplace, putting it to work, so that is not just sitting some place...

Why Your Business Needs Machine Learning - Below is an article by Sara Carta, an experienced tech expert who writes on her site Enlightened Digital, to share her passion with others around the web. After 15 years in the industry, her goal is to bring information on all technology to the masses. Her philosophy is to create each article so that anyone can understand the content, whether a consumer or a tech expert. Check out her site at Enlightened-Digital.com. Machine learning, or ML, is an important advancement for businesses. Computers can now do some of the time consuming work that humans used to do. Those humans can now focus on other more complicated or high level work. It's a relatively new technology, but it's making an impact for all the right reasons. The main benefit of machine learning is that it can gather insights while collecting data and analyze it in depth. It can discover things in the data that people cannot. Which means it's beneficial from a time saving standpoint as well as the quality of insights it can derive. There's more to it than just analyzing data all day, the benefits are numerous and the possibilities seemingly endless...
Why Web Service Data Sources Remain Relevant - Here are some key points: Reporting Services: Developers often utilize XML and web service data sources as sources for Reporting Services (SSRS). These data sources allow reports to retrieve information from external services or APIs. For example, in InetSoft or SSRS, you can configure a web service data source to fetch data from a publicly accessible service, such as a RESTful API or a SOAP-based web service. App Development: In app development, web services serve as valuable data sources. Developers can leverage data owned or managed by third parties. For instance, an app might need to access data from a third-party tool or a public resource. Web services provide a way to query and retrieve this data programmatically. Popularity: According to surveys, almost 90% of respondents actively use web services and APIs. These services facilitate data exchange, integration...