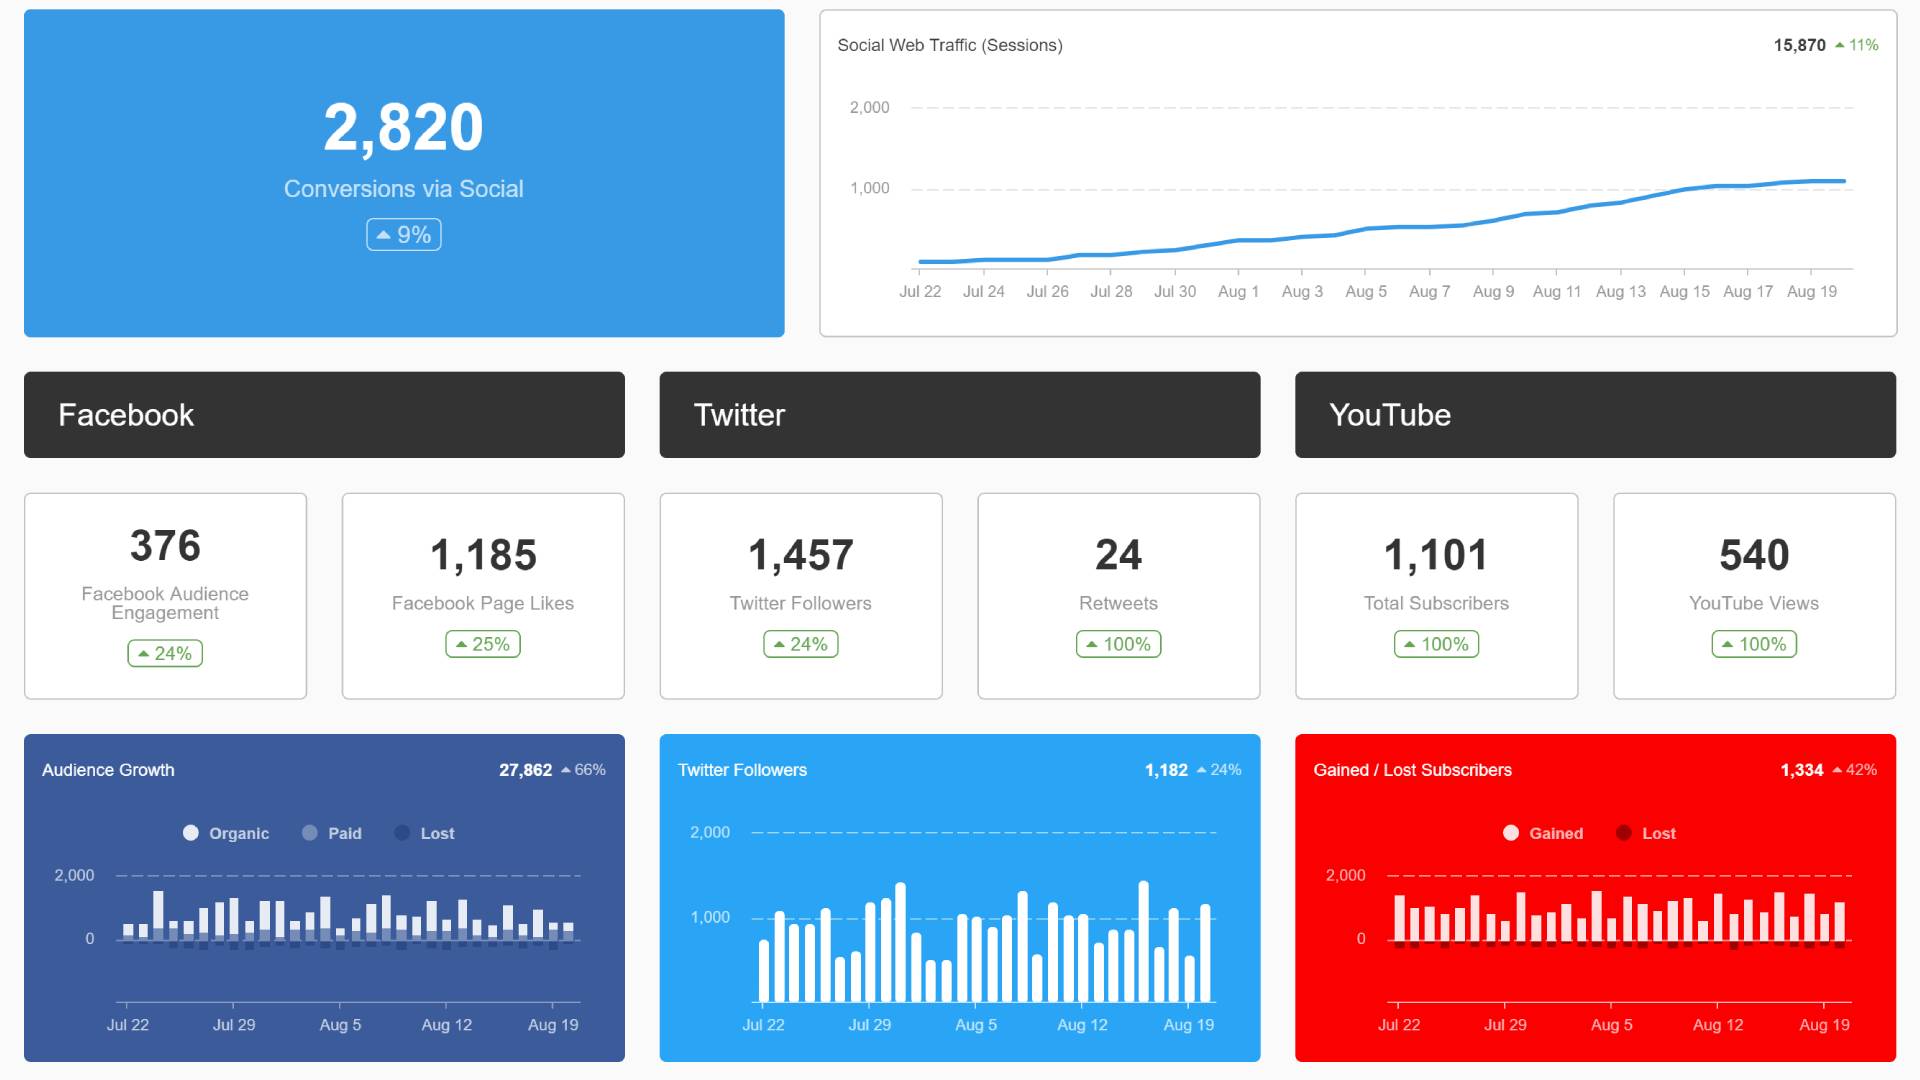
Evaluate InetSoft's Dashboard Solution for Sendible
Are you looking for a better dashboard analytics solution tool for your social media marketing performance measurement than what Sendible provides. Gain greater self-service from personalized dashboards to easier design of new analytics. Create data mashups with other organizational data outside of Sendible for a wider picture of performance. View a demo and try interactive examples.

Register for more information and a personalized demo
About InetSoft
Since 1996 InetSoft has been delivering easy, agile, and robust business intelligence software that makes it possible for organizations and solution providers of all sizes to deploy or embed full-featured business intelligence solutions. Application highlights include visually-compelling and interactive dashboards that ensure greater end-user adoption plus pixel-perfect report generation, scheduling, and bursting. InetSoft's patent pending Data Block™ technology enables productive reuse of queries and a unique capability for end-user defined data mashup.
This capability combined with efficient information access enabled by InetSoft's visual analysis technologies allows maximum self-service that benefits the average business user, the IT administrator, and the developer. InetSoft was rated #1 in Butler Analytics Business Analytics Yearbook, and InetSoft's BI solutions have been deployed at over 5,000 organizations worldwide, including 25% of Fortune 500 companies, spanning all types of industries.

More Resources and Articles about InetSoft's Buffer Reporting Tool
.NET Company Dashboards - Looking for .NET reporting and dashboard solutions? InetSoft's BI software integrates easily into a .NET environment. View a demo and download a free eval...
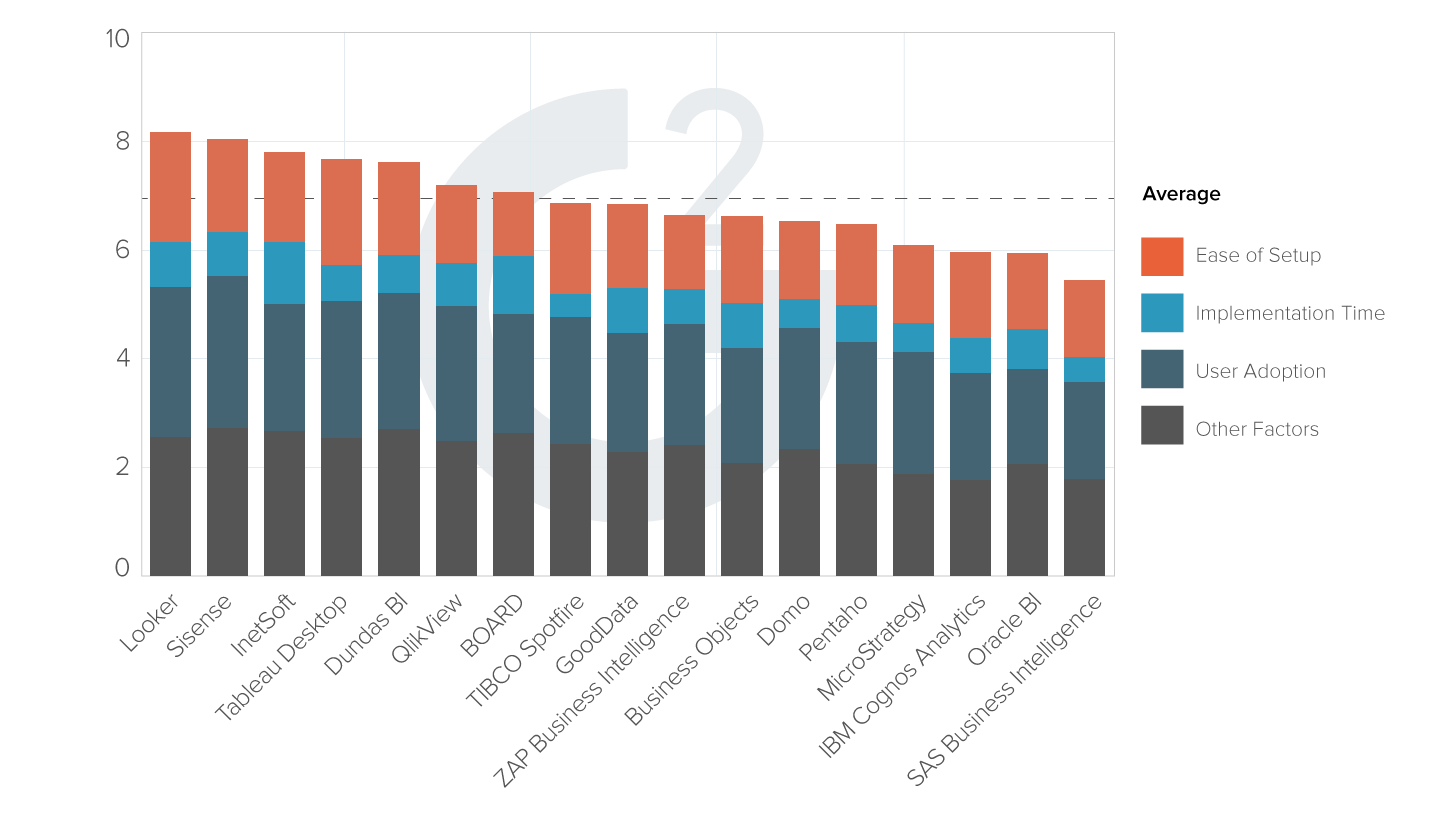
| #1 Ranking: Read how InetSoft was rated #1 for user adoption in G2's user survey-based index | Read More |
Company Hierarchical Data Visualization Dashboard - InetSoft's hierarchical data visualization dashboard allows users to modify and display analytic visual data in intuitive ways. Read the example below to learn more...
Configure Report Server Engine Properties - InetSoft's reporting software makes it easy to configure report server engine properties so that users reap the benefits of the platform's malleable nature. View the information below to learn more about the StyleBI solution...
Curious Industry Dashboard Examples - Are you curious as to how interactive web dashboards can help you explore your business data? Below are some examples of industry-specific interactive dashboards built with InetSoft's StyleBI. Click on any dashboard that interests you, and a live interactive version will open in a second tab of your web browser. You can ask questions of the data in these visualizations by moving sliders and other selection components, hovering your mouse over a given data point, or even viewing and extracting raw filtered data...
Dashboards Better than Reports - Some of you may have noticed that dip in the European sales in the month of August, prompts that the company's European customers were off on vacation at that time and may be its just an error in the data, but overall the U.S. sales increased while Europe largely remained flat. Now, the really interesting pattern here is what was very easy to miss with the report is that the U.S. sales seems to go up and down...
 |
View live interactive examples in InetSoft's dashboard and visualization gallery. |
Dashboard Software Option for Microsoft Access - InetSoft delivers intuitive dashboard software tailored to the needs of small and mid-sized businesses using Microsoft Access and other data sources. InetSoft offers two dashboarding solutions for the business user...
Dashboard Tool for Maximizing Self-Service - Researching dashboard tools for tracking KPIs? Since 1996 InetSoft has been making dashboard software that is easy to deploy and easy to use. Its unique data mashup capabilities enable unified views of corporate performance and maximum self-service...
Difference Between Soft and Hard KPIs - A lot of the KPIs are rolled up. So you are looking at a number that is the aggregate of hundreds of other things. By definition, that is not a discrete number. So often if that metric goes above or below the threshold, you have to take a closer look...
Dynamic Interactive Mashups - InetSoft's dashboard software allows users to create conditions within a report that allow for dynamic interactive mashups. View the example below to learn more about the StyleBI Solution...
 |
Read the top 10 reasons for selecting InetSoft as your BI partner. |
Evaluate Exploring Dashboards - Tips for using InetSoft's gallery...
Evaluate InetSoft's Status Reporting Tool - Looking for status reporting tools? InetSoft is a pioneer in self-service reporting and makes it easy to create status dashboards and report. View a demo and try interactive examples...
InetSoft's Tools for Live Database Dashboards - Looking for the best live database dashboard tools? Since 1996 InetSoft has been making business dashboard software that is easy to deploy and use...
Interface for Monitoring Dashboards - From the monitoring dashboard interface, users can fully customize data using InetSoft's dashboard software. View the example below to learn more about the StyleBI solution...
Read what InetSoft customers and partners have said about their selection of Style Report as their production reporting tool. |
Java-Based Reporting Integration Solution - One of the greatest advantages of StyleBI is its flexibility and adaptability; it does not limit you to a single deployment or presentation framework. Instead, you can seamlessly integrate StyleBI components into your unique application at many different levels...
Pioneering Dashboard Analytics Software - Since 1996 InetSoft has been a pioneering provider of dashboard analytics software. Create quick, accurate, and attractive dashboards in minutes by utilizing an intuitive drag-and-drop design that suitable for all users, regardless of technological prowess. IT professionals can take things a step further using the fully featured scripting engine for dashboard creation...
Production Reports are the Backbone - Operational or production reports are the backbone of most business processes. These reports are typically produced in electronic format and paper printouts for a wide range of users. The vast amount of business knowledge contained within such reports is extremely valuable because they are widely used and time critical. Production reports are often viewed as the most fundamental business intelligence tool...
Rank Groups in a Dashboard - This button is also available for grouping columns. Click the button to open the 'Grouping Options' dialog box. The dialog allows you to perform the following operations...
Read what InetSoft customers and partners have said about their selection of Style Scope for their solution for dashboard reporting. |
Saving Dashboard Data Assets - InetSoft's dashboard software gives users full command of a sophisticated array of data asset controls for a highly personalized and interactive user experience. View the example below to learn more about the StyleBI Solution...
Style Report Java Architecture - Style Report allows IT professionals to create sophisticated production reports that can be deployed for server based, or desktop based applications. The small footprint and 100% Java architecture makes it an ideal solution for embedded ad hoc reports. It is based upon XML, JavaScript, and other open standards technology that allows IT to fully leverage existing skills...
Tracking Sales Leads in a Dashboard - Essentially, what this dashboard does for us is allows our sales team to keep track of how many times a lead was emailed, called, or otherwise contacted by employees or automated measures. It provides our sales team with useful, actionable information that enhances lead conversion...
Using Meta-Templates in Reports - It is easy to design a single simple report from a blank template. However, reports are often more complex, and are related to other reports that share overall report properties, layout, and even report elements. In such a situation, it is best to design a meta-template encapsulating the common features that can form the basis for this group of reports...
 |
Learn how InetSoft's data intelligence technology is central to delivering efficient business intelligence. |
Various Dashboard Data Options - You can use a Variable from the Asset Repository in the filtering condition of a Worksheet Data Table, Named Condition, or Named Grouping. Follow these steps...
Visualization Dashboard Report Tool from InetSoft - Looking for a visualization dashboard report tool? Pioneer InetSoft offers a cloud-based, enterprise-grade solution for accessing multiple data sources and easily generating visualizations to explore and analyze data. InetSoft is top-rated by users on G2 Crowd. View a demo, interact with examples and register for pricing information...
What Is a Dashboard Report Tab - The dashboard report tab allows users to successfully operate the multitude of features in InetSoft's dashboard software with powerful performance monitoring tools. View the example below to learn more about the StyleBI solution...
 |
Learn how InetSoft's native big data application is specifically designed for a big data operating system. |
Which Are the Best Web Dashboard Examples - Below are examples of web-based dashboards built with InetSoft's drag and drop dashboard software StyleBI. Click on the screenshots below to get a closer look...
Work Order Reporting Dashboard - This highly visual and interactive display allows executives to view all the necessary key performance indicators for tracking and managing work orders. In this hypothetical situation the executive can see that work orders have gone down while man hours have gone up. The drop down bars at the top are critical since it allows the executive to filter information based on date, work type, location, and priority...


