Benefits and Examples of Business Intelligence Solutions
What Problems Can BI Solutions Solve?
Examples of Business Intelligence in Industry Solutions
Examples of Departmental Solutions in Business Intelligence
Features to Look for in a Good Business Intelligence Solution

What Is a Business Intelligence Solution?
A BI Solution is a tool that enables employees at all levels of an organization to rapidly access and analyze data to provide insights targeted to the needs of the moment. An effective BI solution provides a high level of self-service so that all members of the organization, from engineers to managers to analysts, can explore data that is meaningful and relevant to their own role without the need for dedicated support staff. Today’s concerns are rarely the same as yesterday’s. A BI Solution must therefore allow data users to quickly reformulate questions, reorganize data, and produce new visual data presentations on a flexible basis to meet business demands as they continuously evolve.

What Problems Can Business Intelligence Solutions Solve?
An effective BI solution has to address diverse problems faced by users of different technical skill levels. For example, IT professionals may need the flexibility to hand-craft SQL queries, parameterize data source connections, customize data-level security and single sign-on (SSO), deploy a server cluster, and tailor business logic using script or a Java API or Web API. At the same time, business users should be able to easily design dashboards and reports to view and share their data without any need for specialized skills. This section explores a variety of problems addressed by a BI solution.
The most basic duty of a BI solution is to efficiently connect to the organization's data stores. Whether data is stored in traditional relational databases such as Oracle and SQLServer, or in NoSQL data sources, REST data sources, Excel files, XML files, text files, Java objects, or any other data store, a BI Solution must be able to effortlessly connect and retrieve data from the data source with minimal special configuration.
A BI solution must also be able to efficiently federate or mash-up data from multiple data sources. In many cases, a significant barrier to business insight is posed by the storage of data in heterogeneous formats or platforms. For example, one department's information is stored in a SQL Server database, while another department's data is stored in Excel files. However, the insights a company or department needs to find a competitive edge often cannot be obtained from a single data source, but only from the conversation between data in different repositories, whether these are different relational databases, or a combination of databases, Excel files, cloud data sources. The BI solution must be able to retrieve data from these diverse data stores, relate and join this data together, and then provide the tools to extract meaningful insight from the pooled data, all while keeping the data fresh and continuously updated from the original data stores.
Another common impediment to effective data usage that a BI solution must address is that in most cases the “owners” of the data are not the same as the “users” of the data. Data ownership is often the province of IT departments, while users of data are often less technical personnel in sales, marketing, or public relations departments. This divide between the people who need the data and the people who have the data often creates a cumbersome hand-off process in which data users need to repeatedly request access from data owners. Without an efficient BI solution, business users have to make individual requests to IT for data source connections, query design, data transform, and analysis. A BI solution must therefore bridge the gap between the data and the user by putting the user in control of data source access, data retrieval and transform, and all aspects of data presentation, and it must do this not by requiring business users to master advanced technical concepts, but by simplifying all these processes so that business users can apply the business skills that they already possess to produce professional analysis and presentation.
Indeed, the concept of self-service is key to an effective BI solution. Users must be able to connect to and manipulate data to suit their current needs, and it is essential as well that users be able to set up their portal, design and modify their own dashboards and reports, configure batch processing and scheduling, share and distribute their work, and do this all without any specialized IT support. By making all aspects of the process easily accessible to the business user, the BI solution removes the limitations presented by business users’ unfamiliarity with database theory or server administration principles. A good BI solution puts the power in the hands of the business user.
A logical extension of this is that when removing barriers between the business user and IT specialists, the BI Solution should also remove barriers between users in different departments. Assets created by one group or department should be easily shared, consumed, and even enhanced by other departments This means that reports, dashboards, queries, and data sources should be fully accessible across an organization, with a comprehensive and flexible security scheme that can grant read, write, and delete permission for all assets and actions based on user, group, or role in the organization.
Another important issue that a BI solution must address is the need to base business actions on fresh data, preventing reliance on obsolete analyses. The imperative of keeping analysis up to the moment cannot be left to chance, but must be built into the BI system. The BI system must have responsibility for refreshing data from data stores on a predetermined schedule, refreshing all reports and dashboards with current data, distributing updated reports and dashboards, and archiving older versions that can be easily accessed for future reference. When data is cached for high performance, the caches must be updated on a regular schedule to ensure that data does not lose its currency.
The BI system should also ensure that critical data events are alerted to relevant personnel. This facility should encompass the ability to draw attention to key data features on reports or dashboards, for example by using conditional formatting, but also include the ability to send alert emails or pop up messages when actionable data events occur or KPI metrics are achieved, or trigger other actions, such as report generation and delivery.
Another challenge that must be addressed by a BI solution is the need to present information both statically in the form of paginated, printable, archiveable reports as well as dynamically in the form of interactive dashboards. Status presentations must be easily distributable in many formats, including PDF, HTML, Excel, Powerpoint, and so on, while interactive dashboards must be able to adapt on-the-fly to devices of any size, from phones to tablets to desktop workstations.
Finally, it is crucial that a BI solution address the problem of scalability. The amount of data and the number of users that a BI system must support is generally not constant across time. An installation that initially processes thousands of records for a few users may need to be rapidly scaled to process millions of records for hundreds of users. An effective BI solution must facilitate this type of expansion by supporting server clustering, multi-tenancy, batch processing, high performance caching, and ability to seamlessly integrate additional data stores as they come online.

Examples of Business Intelligence in Industry Solutions
Business intelligence has penetrated a wide variety of industries because all businesses can derive deep benefits from timely analysis of business data. This section discusses examples of BI Solutions in different industries.
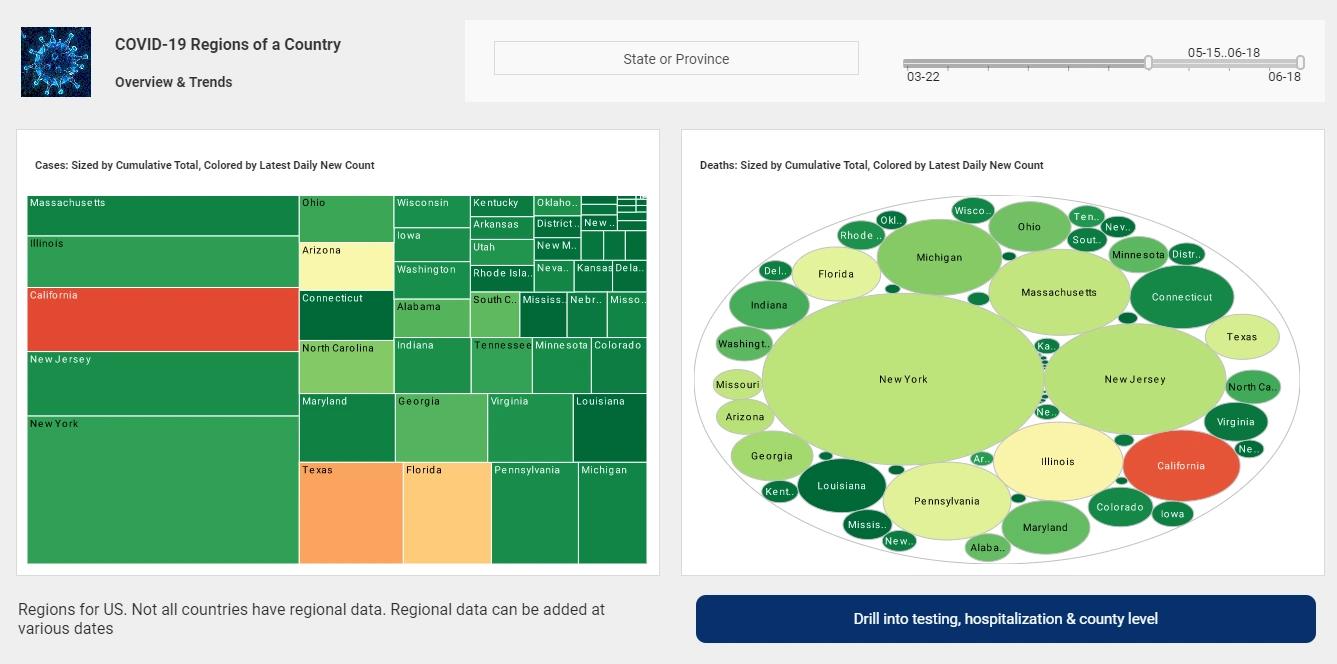
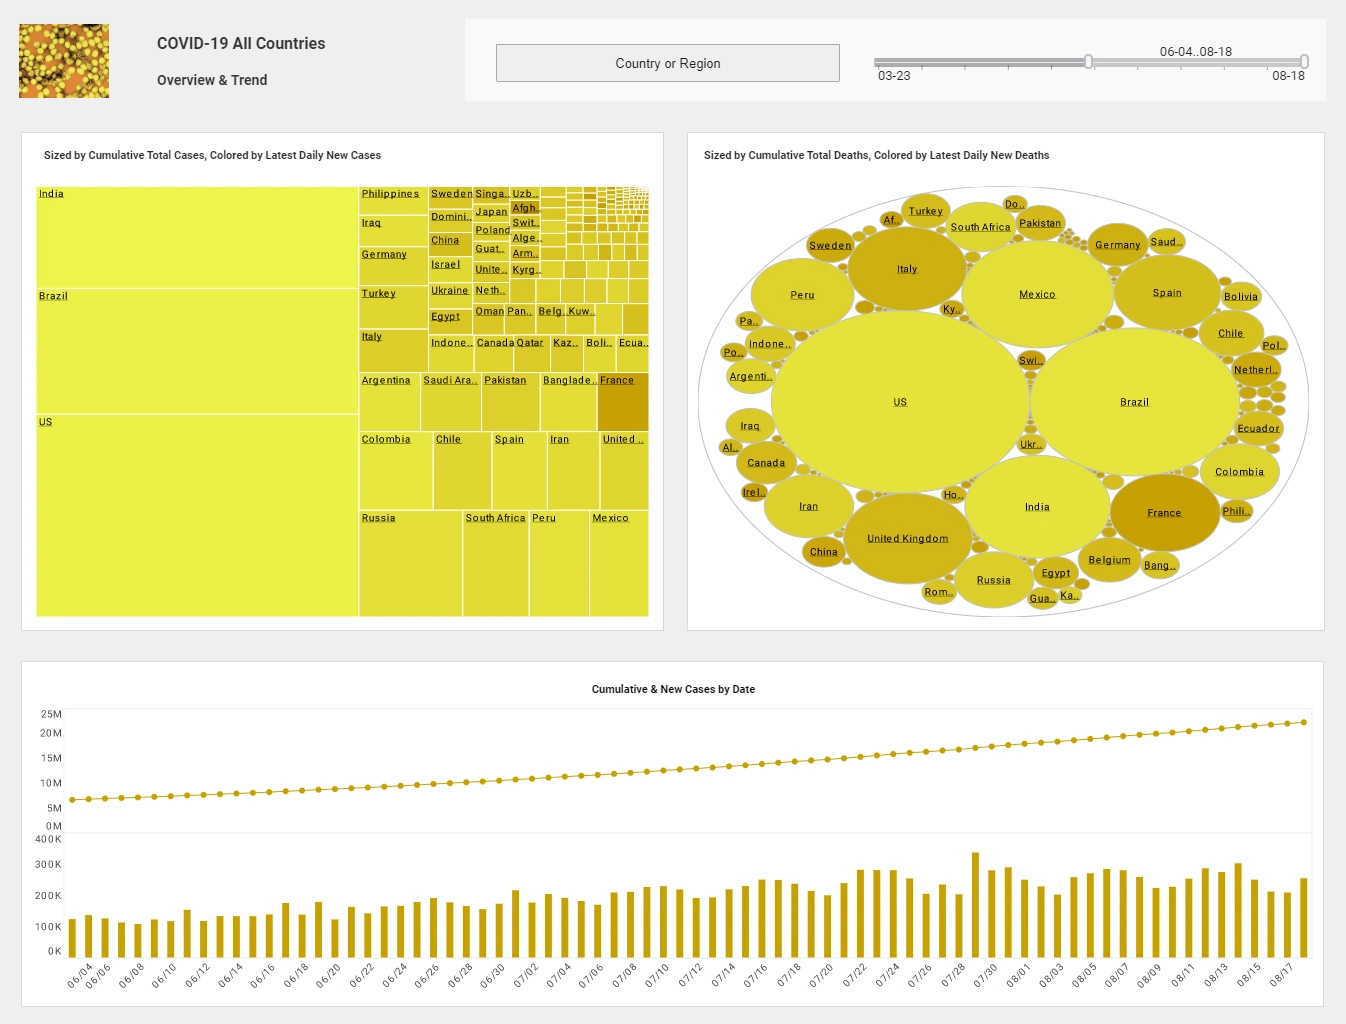
Infectious disease monitoring
In the age of Covid, access to infectious disease data has become a matter of significant public importance. Organizations that collect infectious disease data, such as hospitals, treatment facilities, and governments must be able to effectively communicate meaningful information to the public in order to guide public safety measures and to keep public confidence that such measures are justified and effective. In many cases, the most effective presentation of data is via interactive dashboards that can break down cases, hospitalizations, and deaths along a variety of different dimensions, by geography, region, comorbidity, treatment, political affiliation, and so on. It is reasonable to expect public access to meaningful infectious disease data will continue to grow in the future.
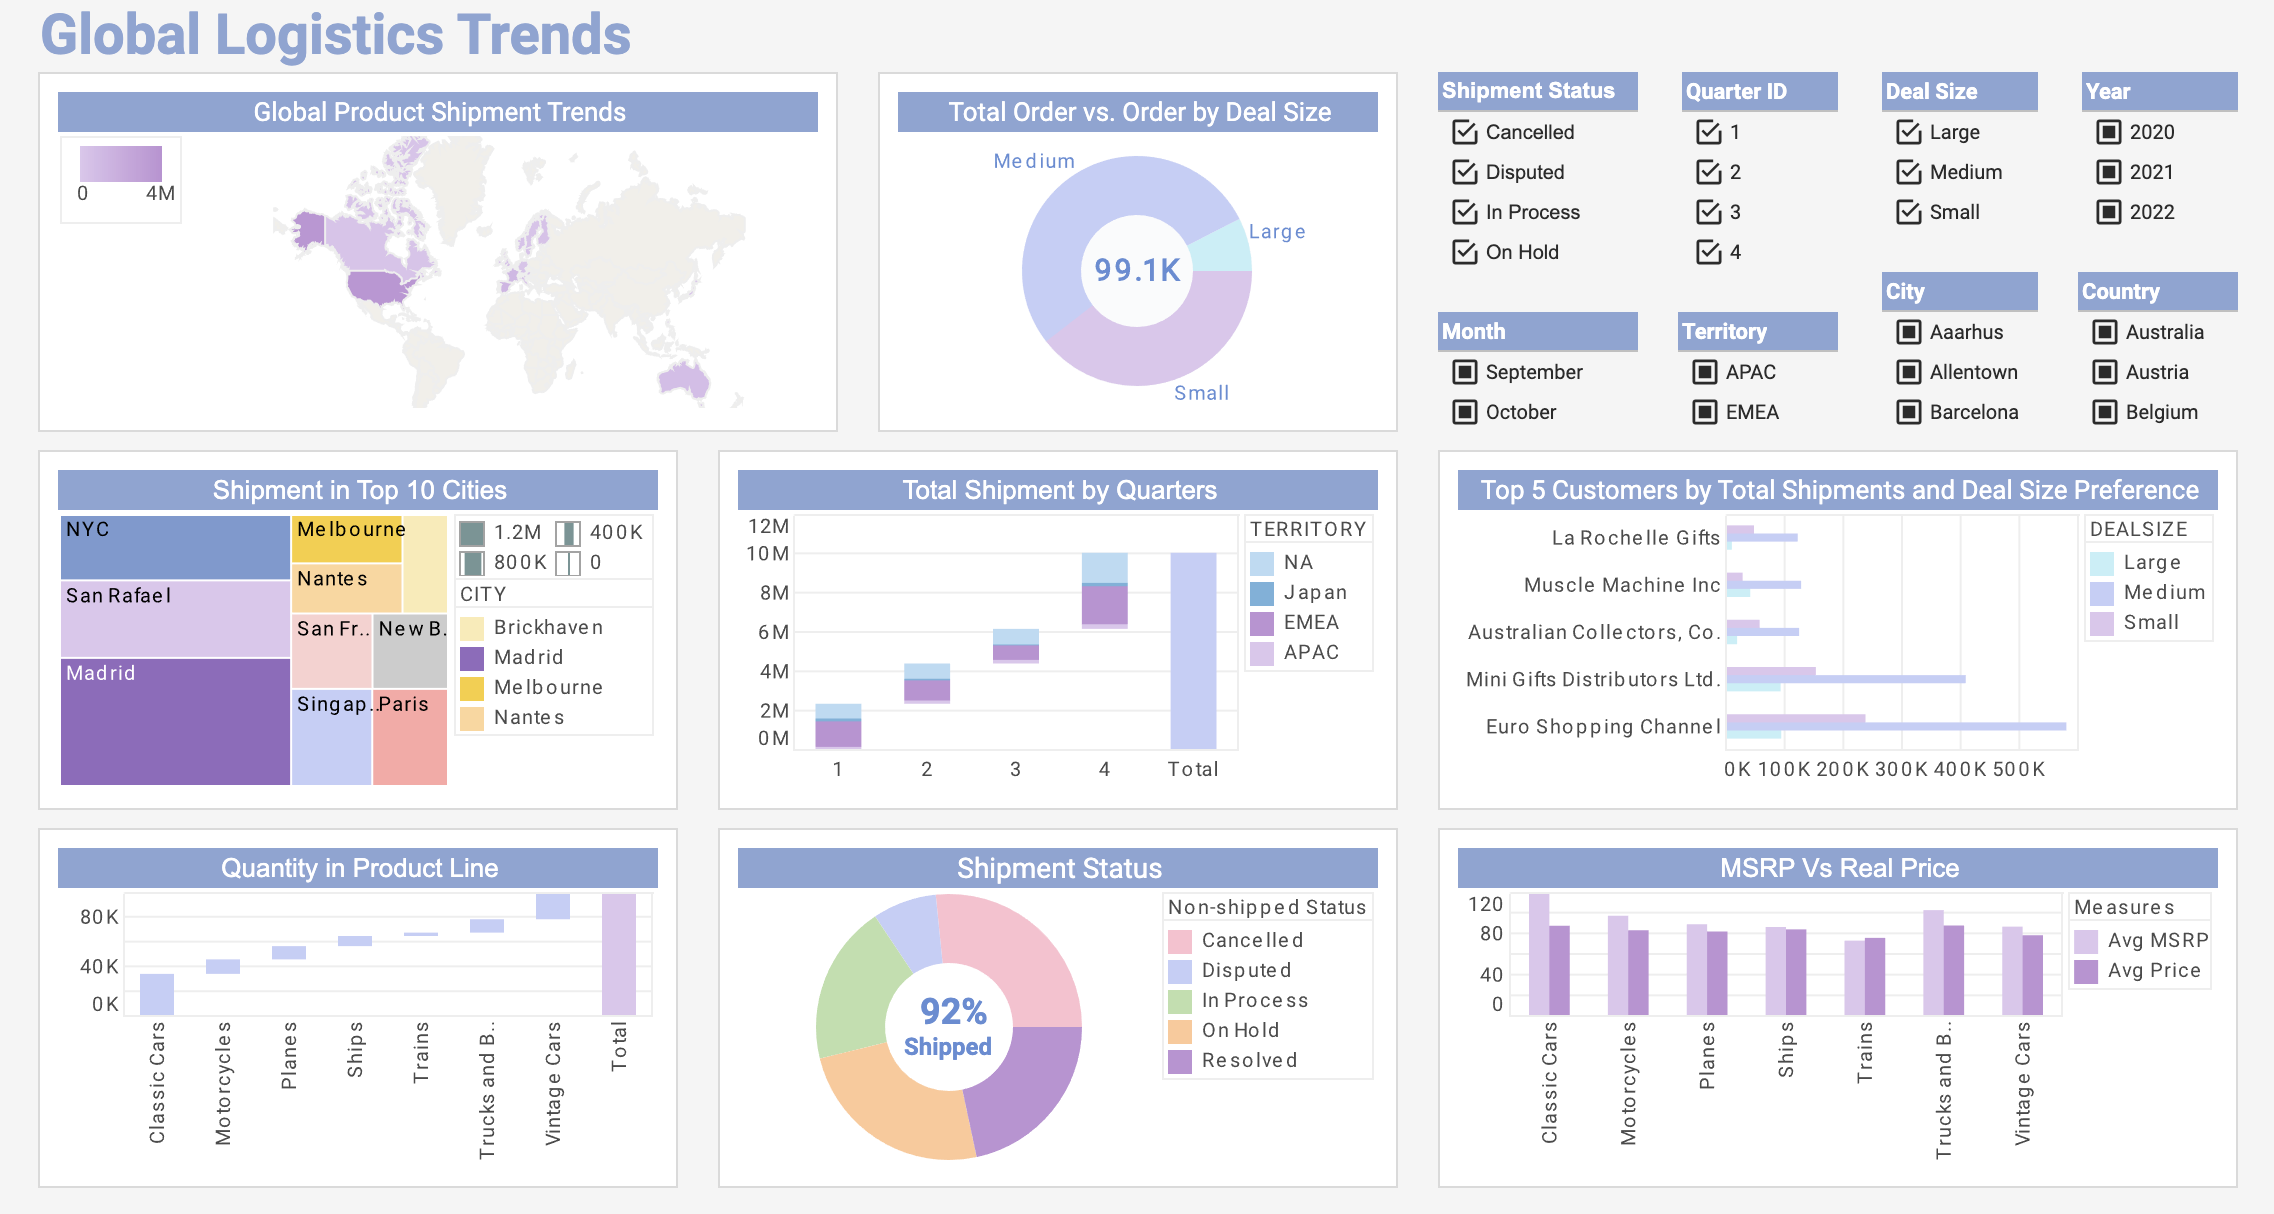
Logistics/Transport
The logistics industry has access to a vast amount of data collected from various sources, and this data can prove invaluable when paired with the exploratory power of a BI solution.
Route planning is a critical aspect of the logistics business, especially among freight-forwarding companies and couriers. Without effective route planning, one can expect many inefficiencies to arise in last-mile shipping and fuel consumption, which can lead to unnecessary delays and unsatisfied customers. An effective data engine can analyze time sensitivity, road traffic patterns, and a variety of other factors to significantly improve route planning, eliminate human error, and expedite the delivery of time-sensitive cargo . The greatest economical gain is provided by an analytical system that schedules deliveries based on concrete data. A BI system should be able to generate dashboards that can be effectively used both in distribution centers and by individual delivery drivers on the road, showing each party a view of the data that is most pertinent to their own role and immediate needs.
For the trucking industry, BI dashboards help perform tasks such as managing freight cost variances, performing recoveries, carrier billings, and more. Effective dashboards and reports can help reduce instances of being victimized by false claims through dash cam analysis, enhance safety for drivers by assembling safety data from relevant sources, provide practical driver training in real-time and through video footage, aid in filing appropriate insurance claims more efficiently, and saving on insurance expenses. This all contributes to reduced delivery costs that provides a benefit to both sellers and their customers.
Managing supply chains is another crucial aspect of logistics. Supply chain models are relatively volatile because of customer demands and supplier relationships. All of this can become overwhelming for those overseeing supply chain models. Regardless of what level a company is in on a supply chain model, dashboards that provide real-time business intelligence are crucial for efficient operations. A supply chain monitoring analytical system providing real-time insights allows logistics businesses to provide an end-to-end seamless journey satisfying all parties on either end of the rope. A modern BI solution will be able to incorporate cutting-edge algorithms powered by machine learning to optimize supply chains. With data collected and processed in real-time, warehouse managers, freighters, and couriers can significantly improve their projections on delivery times, on-hand quantities, and seasonal spikes in usage.
Logistics businesses also manage various assets, such as vehicles or working equipment that need to be periodically maintained. Failure to provide timely maintenance can create major bottlenecks that require additional fees to be cleared. If a delivery vehicle breaks down at an extremely busy time, a company might be required to rent another one to shoulder the burden. That creates unbudgeted costs, reducing profit margins significantly. An effective BI system will prevent situations like this by implementing a predictive analysis system that indicates which vehicles should be serviced based on visualizations of data such as mileage, last service date. These systems could also be paired with vehicle sensors reporting conditions such as terrain traversed, specific faulty parts, and so on. Fleet managers can then focus their efforts on a proactive approach rather than reacting to unanticipated equipment failures. Proactive systems maintenance can significantly reduce costs.
Logistics is also a dominant concern in automated warehouses. Whether automation is robotics or automated replenishers, warehousing companies can optimize their operations even further with advanced analytics and dashboard software provided by a BI solution. Automation generates massive amounts of data that can be mined, analyzed, and processed for higher productivity and optimum performance. By implementing advanced dashboards, warehouse managers can gain access to real-time business intelligence about their operations, for example, determining optimal cargo placement, distribution points, replenishment intervals, and so on.
Scalability is key to revenue growth and a larger market share and in a competitive environment like logistics. A BI solution will facilitate growth by ensuring that all facets of an operation are enhanced and expanded in concert, with resources being appropriately allocated, staff rotated to areas of peak growth, and without any one point becoming a bottleneck.
Education
Educational institutions and organizations that rank and monitor such institutions need to carefully track many aspects of how these institutions are serving the public, and the effectiveness with which they produce an educated citizen body. In addition to tracking traditional measures such as application, enrollment, and retention rates, these institutions as well as student and parent body need to understand how enrollment in various majors and various degree levels break down across gender, ethnicity, and socio-economic level. Effective analysis of this data allows educational institutions to allocate funds intelligently to build up the programs and student demographic they wish to represent, and permits parents and students to select an education experience that matches their expectations.
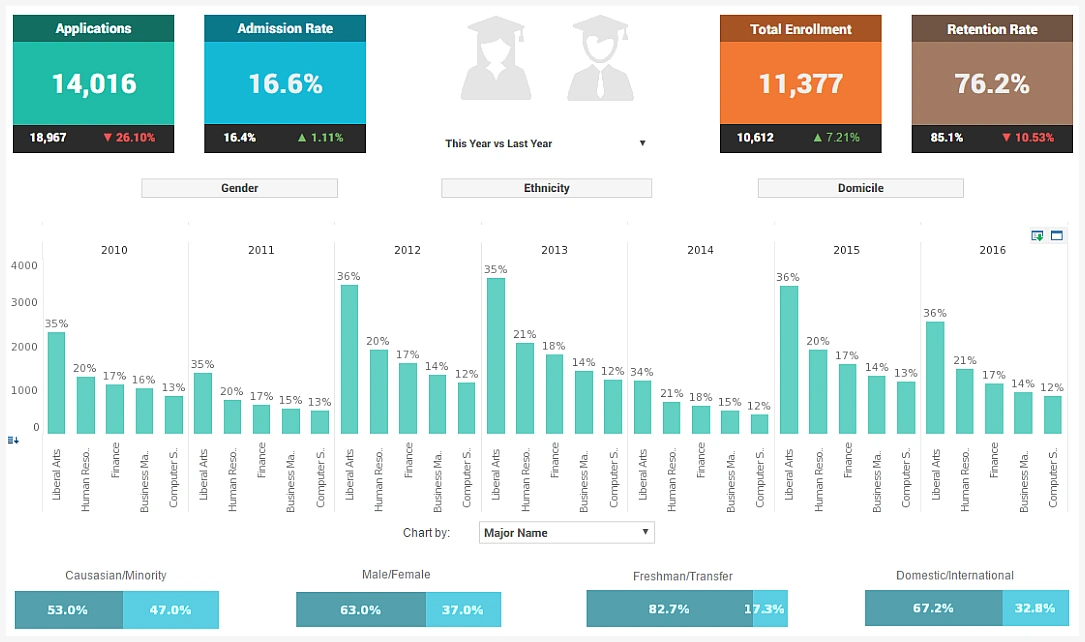
A BI solution for the field of education should also allow administrators to track student placement and performance, graduation and acceptance rates, teacher training and subject expertise, available instructional days, as well as resources such as classrooms, projectors, smart learning tools, and so on. At the individual instructor and department level, dashboards and reports should provide insight into student performance, enabling a teacher to view a student's progress through the semester or over multiple years. Teachers can track the amount of material covered at various levels and across years, and compare test grades on a rolling basis across multiple sections of the same course, with the ultimate goal of ensuring that every student has access to effective instruction.
At the collegiate level, a BI system can help track faculty turnover and tenure, publication rates, course satisfaction and enrollment, travel, conference attendance, advancement in professional organizations, funding sources, grant writing, and all the other aspects of academic life that must work in concert to create a thriving higher education experience.
Since educational institutions are plant intensive, all of the benefits of a BI solution described for Logistics and also apply fully to the field of education. The coordination and optimization of schedules for thousands of students and faculty should be aided by machine learning algorithms, and the maintenance and replacement of educational hardware such as tablets, smartboards, printers, copiers, and many other logistical considerations for which cost and efficiency is a major issue.

Customer Service (Call Center)
In an era where customer support is geographically distributed and often outsourced, it is crucial to be able to verify that key metrics are being met on an ongoing basis. This requires being able to track support volume and rates at which cases are resolved by different team members. It is important that a BI system be able to alert support managers to cases that are not reaching a resolved status, so that these cases can be appropriately escalated and addressed. Customers who feel that their needs are not being effectively addressed can rapidly abandon a product or service. A BI solution can help a support team more effectively identify bottlenecks and increase case throughput.
Call center dashboards are needed in order to monitor key metrics that can change on a minute-to-minute basis. Data needs to be accessed in real time and be readily available to all team members throughout the day, and track key metrics such as success rate, productivity, service level, and more in order to increase company efficiency and decrease overhead costs.
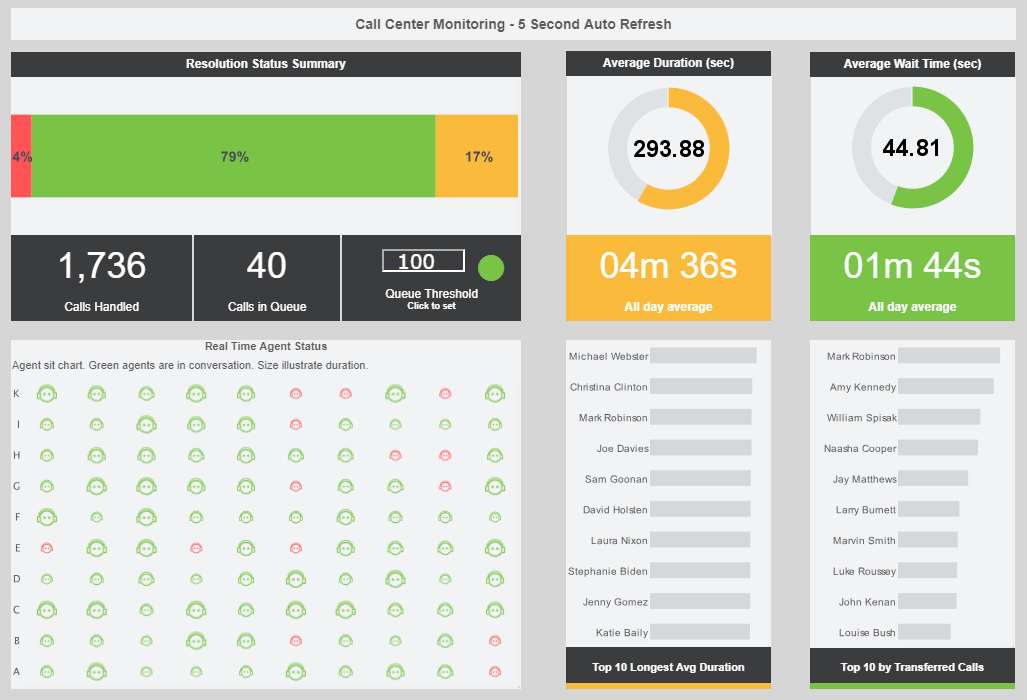
A crucial feature of BI dashboards is the ability to drill down with just a few simple clicks to obtain more comprehensive information than what is available at the summary level. For example, a red point on the heat map may indicate the failure of a support team to meet a target. But what are the details and circumstances of that failure event? An effective BI tool will allow a manager to hover the mouse over that failure point to display more information about the call such as team, month, and success rate. From there, you can isolate all other data throughout the dashboard that has to do with that data point, for example the specific delay that contributed to the failure and the reason for the delay. This makes for operational management of a call center much more efficient.
It should also be straightforward to filter the data on the dashboard to just a single team or agent. For example, if a manager wanted to see the success rates coming from a specific team member on team 6, the manager could click the representative’s name, and this individual’s data would be displayed in a heat map, including the specific call type that was engaged in and the success rate of that area. Dashboard filters should also take the form of range sliders to select desired date ranges, wait times, call durations, target success rates, and so on. Range sliders are increasingly useful as more information is added and specific details get harder to view at summary level. For example, if the dashboard presents data over multiple years, users should have the ability to narrow the information to a few months in order to get a clearer view of that timeframe.
BI dashboards should take full advantage of other common and powerful UI conveniences, such as menus, calendars, tabbed interfaces, hierarchical filters, and dynamic charts and tables that can display a variety of different dimensions and measures according to user needs. All of these features make BI software an essential tool for managing a support team.
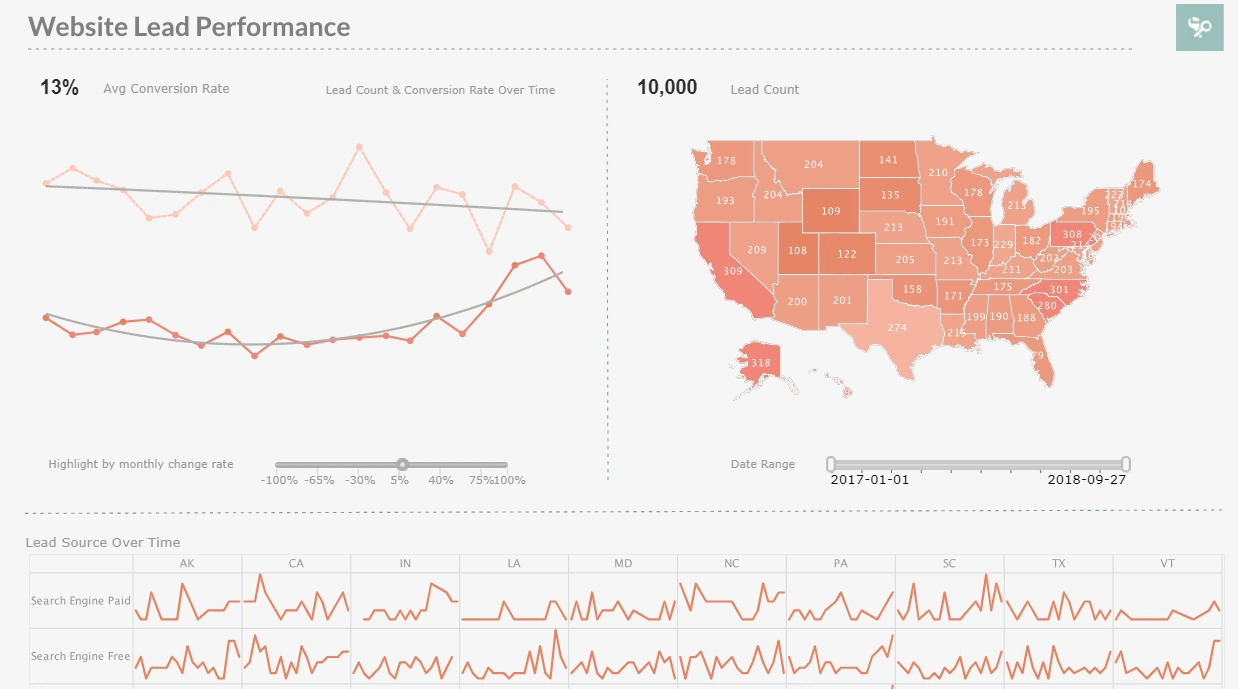
Website analysis
A website is the lifeblood of many businesses today, and understanding website traffic is key to improving market penetration, increasing product appeal, and directing product and service development. Artificial intelligence and machine learning tools provided by a BI solution such as non-parametric clustering and word-maps can be an enormous asset in obtaining an unbiased look at user preferences and patterns of usage.
Economics
Analysis of economic data is foundational to government and financial organizations around the world. A BI solution must be able to federate data from a wide variety of data sources, including employment, inflation, census, housing, energy, and consumer data, and present meaningful analysis to managers of government agencies, central banks, and other financial institutions that will facilitate prudent and timely decisions for adjusting investments, revenue sources, spending and so on. Look-ahead or predictive analytics is also essential to projecting where economic indicators will likely be positioned in three months, or six months, or a year.
Healthcare Analytics
The ability to effectively analyze massive amounts of healthcare data has never been more important. A BI solution can allow health insurance companies better understand their costs and patterns of healthcare services in the networks they administer. It can also help governments and oversight agencies assess the delivery and cost of healthcare and evaluate health outcomes for a variety of conditions in comparison with different geographical regions or national health delivery systems.
For healthcare businesses, the immense amount of data includes patients' medical histories, appointments, physician schedules, and staff data metrics. Healthcare IT also encompasses many other critical facets including security measures in electronic health records. This is why the health informatics profession is vital for maintaining a viable healthcare system.
Healthcare informatics is a multidisciplinary field that uses information technology to manage patient healthcare information for effective clinical use. The ability to analyze all of these various data sets requires more than just a spreadsheet, especially if security concerns are to be effectively addressed to ensure patient safety and satisfaction. Security has developed into a major topic of concern in the health industry due to the use of electronic health records (EHR). EHRs are used because of their ability to maximize patient efficiency, but have opened many concerns about patient privacy. Security is especially important in healthcare due to the profound impact security leaks can have on patients' lives. If patients fear that their information is not properly protected they may forgo seeking treatment when symptoms begin to occur. This fear-induced avoidance could cause illnesses that are easily treatable in the early stages to turn into a chronic or life threatening situation.
A robust BI solution will be able to implement security at many different levels and entry points to ensure that all sensitive data is protected, and that patients feel safe seeking care. As for all complex systems, A BI solution must also be able to track internal system metrics, such as system uptime, system downtime, downtime causes, reliability, latency, network performance, and so on.
Legal
As with a Legal Department in a larger corporation see below), a BI solution can provide a flexible dashboard reporting system to track performance of its attorneys' productivity, find hidden trends, compare milestone performance, and identify top performers. Important KPIs to track include number of matters opened, hours worked, number of average days billing in lockup, average fee per matter, and ratio of average billed to average worked rate.
Other important metrics include billable hours per full-time equivalent timekeeper, which is calculated by taking the gross number of billable hours worked by paralegals, associates, and partners and dividing by the number of full-time equivalents in each category. Another KPI in this domain is the ratio of average billed to average standard rate, which is the ratio of the average billed hourly rate for a timekeeping category, calculated by dividing fees actually billed by the hours billed to the average standard hourly rate for the category of timekeeper. Then you have case win-loss rates by proposal type, opportunity source, category, and attorney.
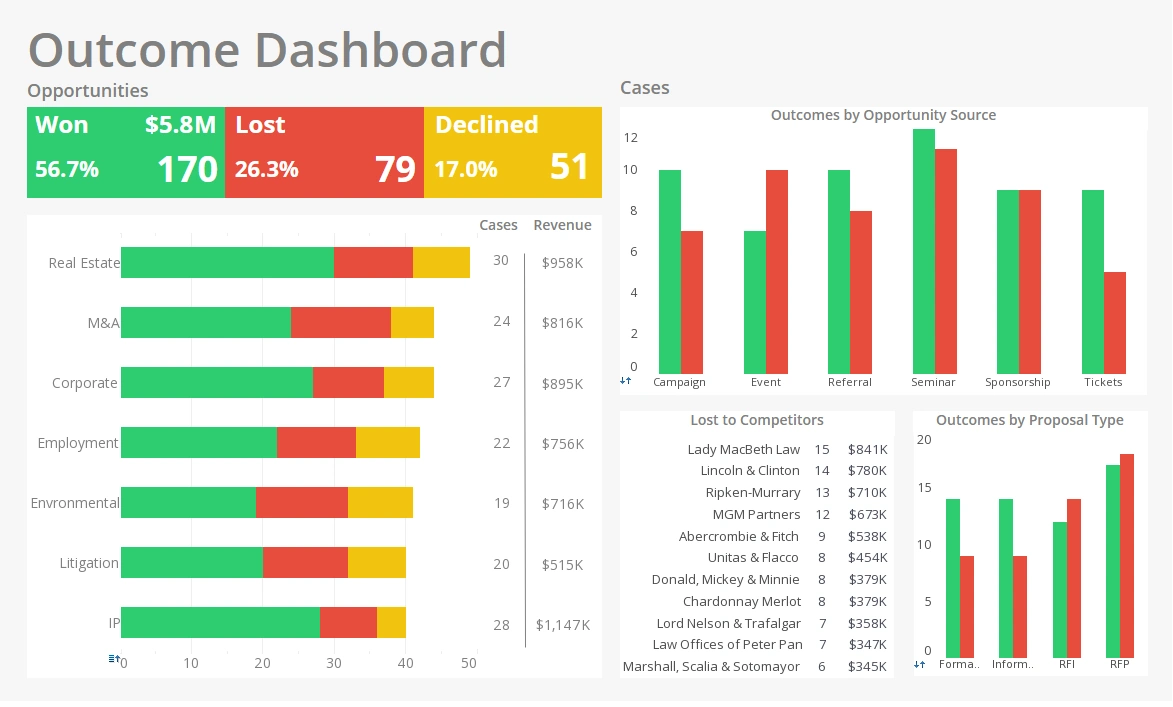
A key area to manage proactively is the performance of the existing client base. KPIs in this area include client retention rate, which is the ratio of number of clients billed in the last 12 months to the same clients that had been billed in the 12 months before that, and the dormant client percentage rate, which is the ratio of the number of clients for which the firm has not handled a matter in two of the past three years to the number of total clients.
All of these metrics, and many others can be neatly packaged by a BI solution into explorable dashboards, and easily digestible reports that any non-technical partner can use to manage their team.
Food Services
Restaurants are busy and have different sales points. A BI solution can provide sales dashboards that visually represent all the restaurant's sales information, including inventory updates, revenue collected, and team performance. Based on analysis of performance data, managers can change plans, alter decisions, adapt rewards, increase allowances, and take note of redlines before the restaurant begins to suffer losses.
Restaurant suppliers are like another team of non-official staff because they supply all the needs of the restaurant, without which the business would collapse. There are different suppliers for dry foods, green vegetables, fruits, detergents, gas, fabric, furniture, stationery, uniform, etc. The restaurant manager must be able to ensure that each supplier receives the appropriate order at the appropriate moment to ensure that there is never a lapse in fresh supplies, and must be prepared to immediately switch to alternate suppliers if orders cannot be fulfilled. An effective BI dashboard should allow a manager to keep track of purchases, documents for compliance, pre-qualifications, inventory that accounts, received and returned goods, etc.
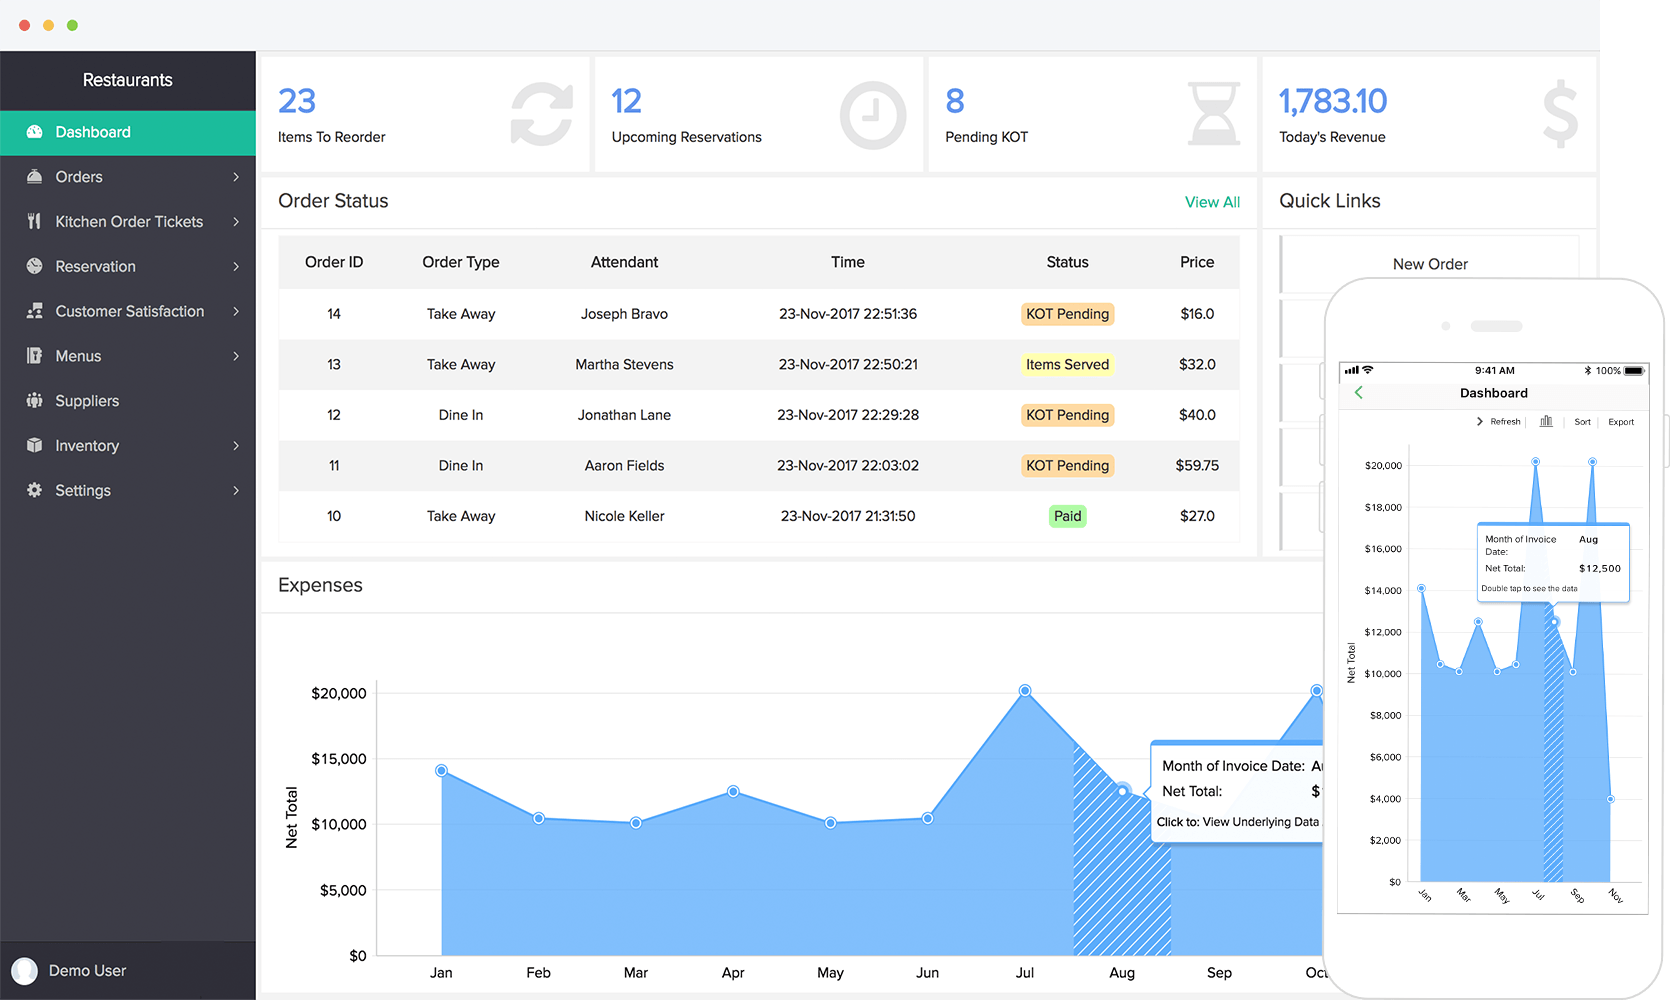
HR managers in a food service environment may need to supervise tens or hundreds of workers who report at different times of the day and work for a specific number of hours. An effective HR dashboard will allow the manager to track workers time, responsibilities, performance, potential substitutes, and pay.
Beyond a restaurant's physical presence, it may also have a large online presence on various marketing platforms such as email, blogs, social media, and YouTube. The restaurant may additionally be offering home deliveries, outdoor catering, events and online booking. In many cases, the online restaurant may be a different department under an online marketing manager. Business that comes through the online channels is recorded in the online channel’s dashboard. By using the online dashboard, the online marketing manager can report on the client's engagement with the restaurant across all the online platforms and extract data from visitors on the various social media platforms like Instagram, Twitter, Facebook, LinkedIn, Pinterest and YouTube. The dashboard will reveal real-time data on the number of people who ordered food online, how many people clicked on the restaurant's ads, which online events and contests have been organized by the restaurant, the performance of the email marketing team, and so on.
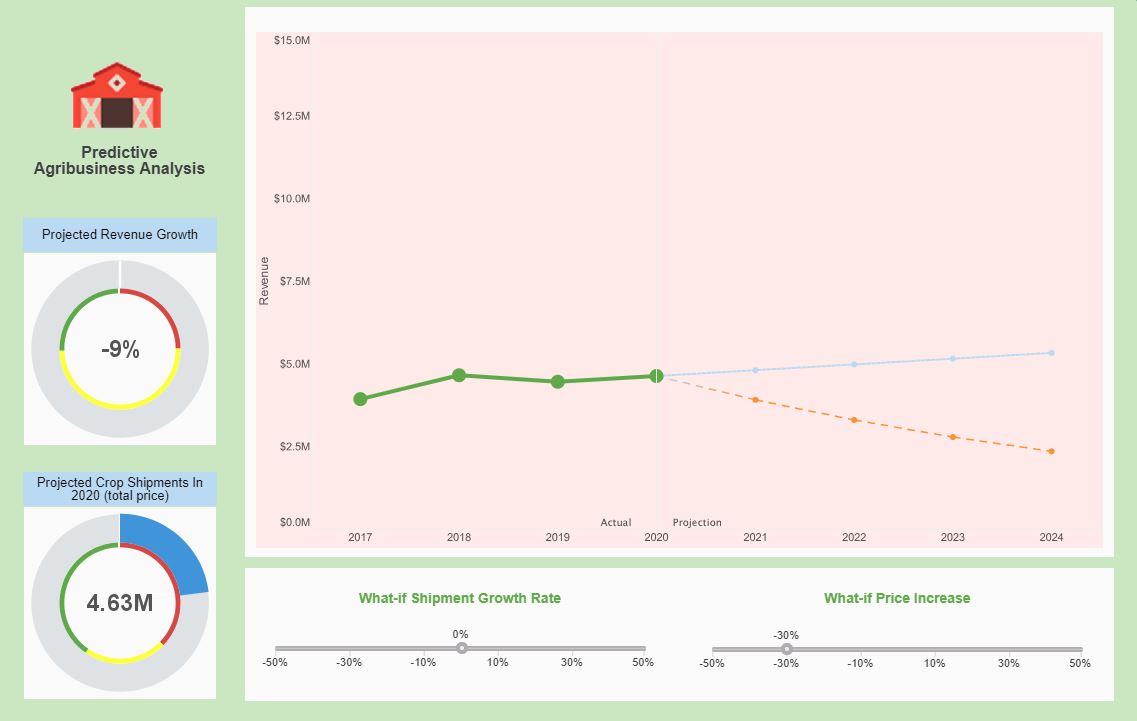
Agriculture
The agricultural sector is seeing major shifts in its supply chain due to the introduction of Big Data to the industry. Smart sensors and devices powered by the latest technologies like artificial intelligence, the Internet of Things, and Cloud Computing, allow accumulation of massive volumes of data that are revolutionizing the cyber-physical farm management cycle. Big Data is being used to predict the best practices in farming operations, support operational decision-making processes in real-time, and re-design business processes to improve business models and innovate new ones. A robust BI solution is needed to make sense of the vast quantities of data.
Farms and other agricultural enterprises are just as sensitive to prices in the market as any other industry. Knowing which key metrics or KPIs (key performance indicators) to study can help farmers keep a check on rising costs or tumbling revenues. The continuous feed of data allows them to take timely action and increase their productivity and profit. Agriculture researcher and assignment helper Vinay Ahuja says, “KPIs help agricultural businesses save time and make optimal use of their resources by taking evidence-based decisions.” He suggests some of the metrics that aid the smart farming trend:
-
Feed and water consumption: Water, manure, feeds, pesticides, and insecticides cost a significant sum of money in agriculture. Data-driven agricultural decisions can help minimize their use without damaging the crop or stock.
-
Wages to revenue ratio: Farmers would like to pay out less and earn more but it has been observed that those who pay higher wages to their employees see more productivity and profit. This metric can guide farmers to see how the wages to revenue ratio impacts their profitability.
-
Yield of stock: Most agricultural businesses have limited resources. The yield of stock can guide them to assess how many bushels of corn you grow per acre or how many cattle-heads can you rear in your farm. You can relate this with data related to weather, rearing or farming processes, and natural disasters to find out how different factors affect the yield.
Agricultural productivity can strengthen a country's food security and economy and can also help with conserving its environmental resources. Three types of productivity metrics that can help a achieve sustainable productivity are Partial Factor Productivity (PFP), which measures output per unit of one input, Total Factor Productivity (TFP),which measures total marketable outputs vs total marketable inputs in an agricultural production process, and Total Resource Productivity (TRP), which measures non-market factors (such as environmental factors) and their impact on production efficiency.
A BI solution can help an agricultural enterprise analyze data over the long term and understanding inter-relationships between different ecosystems can help make agriculture more sustainable and resilient to challenges like changing weather conditions. Data related to soil quality and moisture, water quality, wide-area mapping, biodiversity, non-cropped vegetation, and pests and diseases can help policymakers in coming up with safe operating practices, setting local thresholds, and deciding early warning indicators.

Systematic and reliable collection of data at the local, national and global level opens up many new opportunities for agricultural innovation. Investing in the digital exchange of real-time information and learning can democratize information and empower farmers to make informed choices. It can also help in achieving Sustainable Development Goals (SDGs) and accelerating the pace of development. Existing technologies like Geographic Information Systems (GIS), Global Positioning Systems (GPS), and Remote Sensing can help in shaping up the digital agriculture world where data and information are transparent, easily shareable, and disaggregated. Population and agricultural census data, national household surveys, surveys on market and consumer behavior, and composite indices that keep a track of multiple functions of agriculture and food systems are some of the other records that can be used to anticipate, track, and manage agricultural challenges.
Tanja Folnovic, an agronomy expert, writes in a blog post that rain-fed agriculture accounts for 60% of food production in developing countries from 80% of arable land. On the other hand, 20% of arable land which is irrigated produces 40% of all crops and almost 60% of the total cereal production. It is expected that by 2050, the demand for freshwater would increase by 18% in developed countries and by 40% in developing nations. Hence, achieving water efficiency needs to be a priority for agriculturists. Data-driven irrigation systems can achieve high water use efficiency and help farmers in optimum irrigation scheduling. Water productivity data can help farmers predict loss of yield due to water stress, predict improvement in yield with supplemental irrigation, and improve the allocation of water supply among farmers, among crops, and during different growth stages of crops. Granular data on rainfall patterns and fertilizer requirements can go a long way in feeding the growing population worldwide, and can also help farmers mitigate the side-effects of pesticides by advising when to use them and by how much.
This “Stewardship Index for Specialty Crops” (SISC) rubric allows sustainable and optimal production of specialty crops, such as fruits, nuts and vegetables. It consistently measures on-farm metrics accurately. Run by a coalition of producers, buyers and public-interest groups, SISC develops and refines tools for farmers that measure specific outcomes that address the unique needs of the specialty crop industry. Eight key metrics SISC measures are Applied water use efficiency, Habitat and biodiversity, Energy use, Nitrogen use, Phosphorus use, Soil organic matter, Simple irrigation efficiency, and Food loss. A BI solution can help integrate and explore this data to enhance sustainable farming practices.

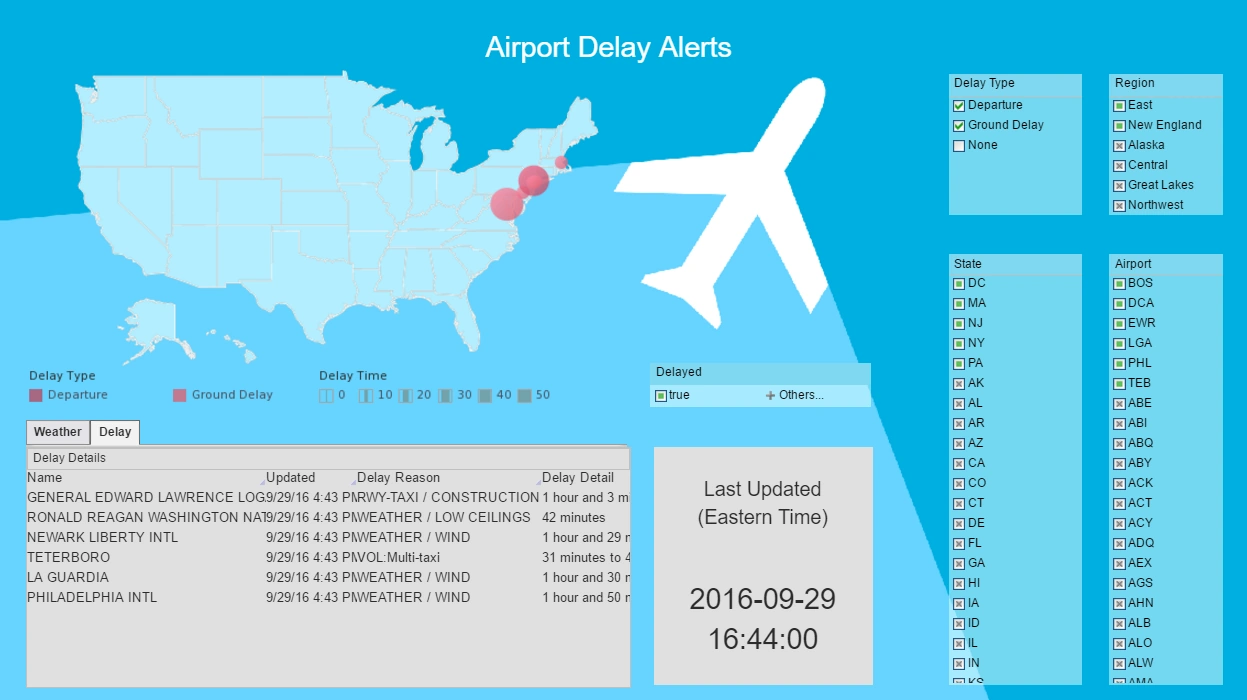
Airline Industry
It is exceedingly common nowadays for individuals to arrange their own airline travel by using online services such as Expedia or Travelocity. The simple interfaces provided by these apps disguise the massive databases that store information about flights, schedules, destinations, equipment, maintenance, personnel, customers, promotions, security, and facilities that all need to be coordinated to make modern air travel feasible.
Those who manage these operations, and those who monitor the industry, need a BI system that can present this information in a way that can be easily comprehended by the professionals who need to ensure that operations proceed flawlessly. For example, a world map can provide graphical information about the status of recent flights, plus important indicators like average delays, arrival and departure punctuality, and so on. Airports and hubs can be highlighted in different colors to show delay status, maintenance issues, and so on. BI dashboards can also facilitate comparison of fleets (for example, Boeing and Bombardier), flight regions (Africa and Asia), routing, weather situations (TAF or METAR), luggage losses and delays, and fuel consumption.
Airlines constantly collect information and analyze data about customers and their preferences. This allows them to offer personalized packages, experiences, and prices. By using BI tools, companies can understand what travelers want and expect and can offer them the options they like. This also enables both passengers and airlines to avoid numerous problems and unnecessary expenditure associated with baggage delays, security screenings, airport traversals, flights cancellations, boarding, food, beverage, and entertainment services. Load management can be optimized up until the day before departure. Discounts can be applied based on up to the minute competitive information.
Modern systems can utilize BI to allow technicians, managers, and other specialists to get timely reports and information about their fleet, airports, and other aspects no matter where they are, and what device they rely on. When management receives regular notifications and alerts, it is much simpler to address issues before they can impact the flight schedule, customer confidence, or safety. This, in turn, will lead to better operation of all airline divisions.
App Development
Like all service providers, mobile app developers need to track monthly and daily active users, and ARPU. Other key metrics particular to application providers are downloads and conversion rates. BI dashboards provide easy-to-use tools to design whatever monitoring and analytical dashboards are desired by the marketing function, finance department, or c-suite.
Another key area for service providers like app developers is customer churn. Dashboards can facilitate grouping by cohorts of app downloaders or periods of acquisition, and compare retention rates to provide insights into application preferences, promotional drivers, and version improvements. This kind of dashboard allows monitoring the stickiness of apps, the ultimate key metric for a solution provider. Other important engagement metrics that can be compared across applications and acquisition periods include conversion rates.
Mining
BI dashboards can provide extensive benefits to the mining industry. There has been an increase in the level of automation in the mining industry in recent decades which has made it more challenging to ensure full-time monitoring. It is costly to shut down mining activity to carry out reactive or planned maintenance. This is why it is essential to know what is most likely to fail, and more importantly when it is expected to fail. A BI dashboard can be the game-changer in the mining industry in which every minute of operation counts.
Consumption of raw materials and power and associated environmental pollution all need to be factored into a complex decision-making process. A deep understanding of operational parameters and failure modes are necessary to create mitigation strategies that are effective against the failure of equipment and other mishaps that might cause environmental damage. It is essential to have all relevant information immediately available in easily interpretable form to understand what actions will be environmentally sensitive and cost effective. A crucial aspect of mining is the safety of personnel. Although worker safety also holds so much importance in other sectors and industries, within the modern mining industry this needs to be the top priority.
As a part of the strategy to protect the personnel, devices worn on the body can feed data to a safety dashboard so that managers have immediate access to vital information for the continuous monitoring of personnel deployed to high-risk environments. A mining operation may utilize data from a wide variety of sources: Master data management and geoscientific systems like GeoSequel, acQuire, Vulcan, Deswik, etc., fleet management systems like Sandvik OptiMine, Wenco, GroundHog Fleet Management, JigSaw, Modular Mining, and Caterpillar MinesStar, equipment health data from the major manufacturers of heavy equipment like Caterpillar, Terex, Hitachi, Sandvik, Komatsu, Liebherr, Epiroc, John Deere, Doosan, etc., drone data from volumetric data providers such as Propeller, Kespry, and others, and ERP Data from companies like SAGE, Oracle Financials, and SAP. These systems provide decision support and are created to help the mine managers, corporate officers, and other supervisors make decisions that are entirely data-driven, but to accomplish this effectively without overloading managerial positions, this data must be aggregated, synthesized, and presented in an automated fashion so that managers see exactly what the need to see. This is what a BI solution can accomplish for mining.

Departmental Solutions in Business Intelligence
A BI solution should be able to penetrate a wide variety of departments in a corporation or institution. The following sections provide examples of the broad applicability of Business Intelligence.
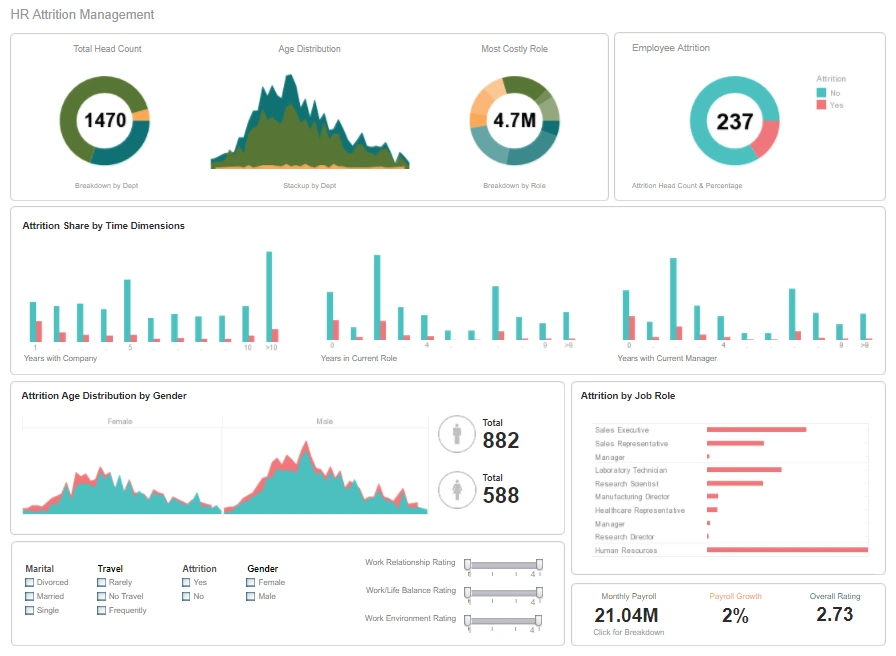
Human resources
A human resources department needs to manage a vast assortment of data relating to compensation, benefits, health insurance, performance rating, onboarding, attrition, training, travel, dispute resolution, and so on. A BI solution provides human resources professionals a view into the current state of the organization’s personnel as well as the ability to track historical patterns in hiring, training, certification, vertical and horizontal personnel movements, and the costs associated with all personnel operations.
The needs of the human resources department are typically served by both reports, for study of historical patterns, and by dashboards for up-to-the moment snapshots of the status of company or organization personnel. For example, it may be necessary to monitor attrition rates across different departments and other dimensions such as gender, training level, and compensation bracket, to ensure that the company is maintaining staffing with the desired diversity and skill profiles. Alerts should be configured to notify managers if metrics are failing to meet targets and action needs to be taken in terms of hiring or maintaining competitive compensation packages. A BI system can also implement security based on users, groups, or roles to enable department managers to see HR data corresponding only to their own department, and allow individual employees to access only their own data, thus maintaining employee privacy.
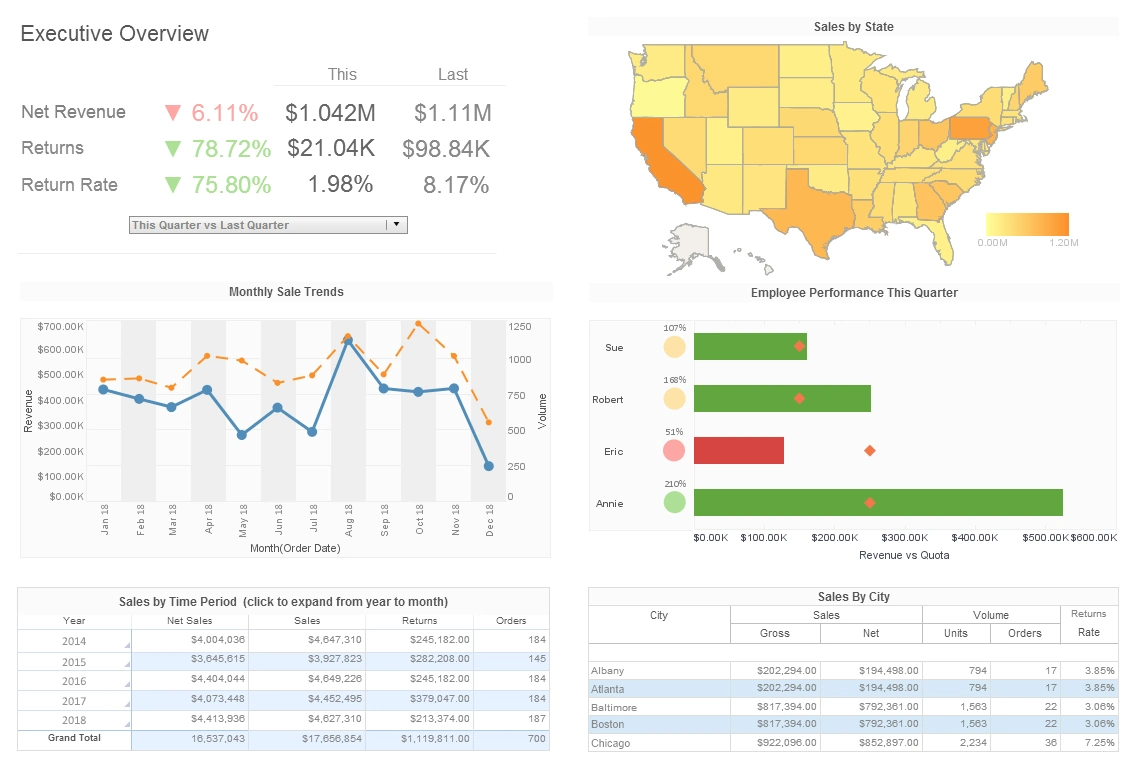
Sales
CRM systems have not only streamlined sales processes but also provide a great source of customer data. However, the CRM database still only covers part of the customer journey. In order to fully develop customer accounts, all customer related data must be marshaled.
Just like CRM systems, other software such as order management and call center software are now also being offered as SAS (software as a service) packages, even as long-established and trusted on-premise software are still important for customer related assets. Third party data such as social media often are also critical in understanding customers. A BI solution enables data-oriented sales operations analysts to rapidly mashup this variety of data and extract intelligence that will improve sales effectiveness and maximize cross selling.
Distribution dashboards help to measure and assess different KPIs. The most important four key performance indicators are order lead time, which estimates the average period required for a product to be delivered to a customer, perfect order rate, which calculates the order quantity obtained from the distribution center, backorder rate, which assesses the level at which orders are carried out for out-of-stock goods, and lost sales, which detects the number of quotes that don’t lead to any income. Distribution dashboards can also help with improving packing cost, order cycle time, vendor performance, etc. Without BI dashboards, it would be impossible to comprehend the quantity of information generated by sales channels. Dashboards help to sort data, highlighting vital content, and give employees instantaneous access to the information they need to drive a sale to completion.
Enterprise asset management
A BI solution can be an essential element of managing business assets, from business hardware and software, to manufacturing and industrial equipment, to maintenance protocols, and so on. Asset Management must be able to track and predict maintenance and replacement costs, and manage orders to suppliers and contractors. A BI Solution can provide dashboards to technicians and maintenance personnel to support an effective plan of equipment assessment, renewal, and replacement. Dashboards can report age of equipment, hours of use, service periods, maintenance costs per unit, and so on. Alerts should be implemented to notify key personnel when equipment is reaching end of service life, and when replacement parts need to be ordered. A BI system should also interface with supplier databases to ensure that supply chain issues do not disrupt operations, and that expense shifts due to supplier pricing changes can be anticipated and communicated to management in a timely manner.
In an era of rapidly increasing costs, dashboards and reports on asset utilization also give management a view of how expenses are distributed across different parts of the organization and physical plant. This can allow management to investigate why asset usage in one area is much higher or lower than another, which in turn may suggest that a certain department has discovered efficiencies that can be shared with other parts of the company to reduce costs. Productivity is maximized by visualizing which projects are going over man-hour budgets.
Among the many metrics that dashboards should track for asset management are equipment downtime, maintenance backlog, percentage of planned work for prior month, maintenance cost as a percentage of equipment replacement value, percentage of preventive maintenance (PM) and predictive maintenance (PdM) worked in the prior month, percentage of PM and PdM overdue in the past month, accuracy, maintenance, repair and operations (MRO) inventory turns, MRO inventory as a percentage of equipment replacement value, total value of outstanding purchase orders, and total value of receipts that have not been invoiced. Effective decision making requires easy access to all of these variables, and providing this is the role of the BI solution.
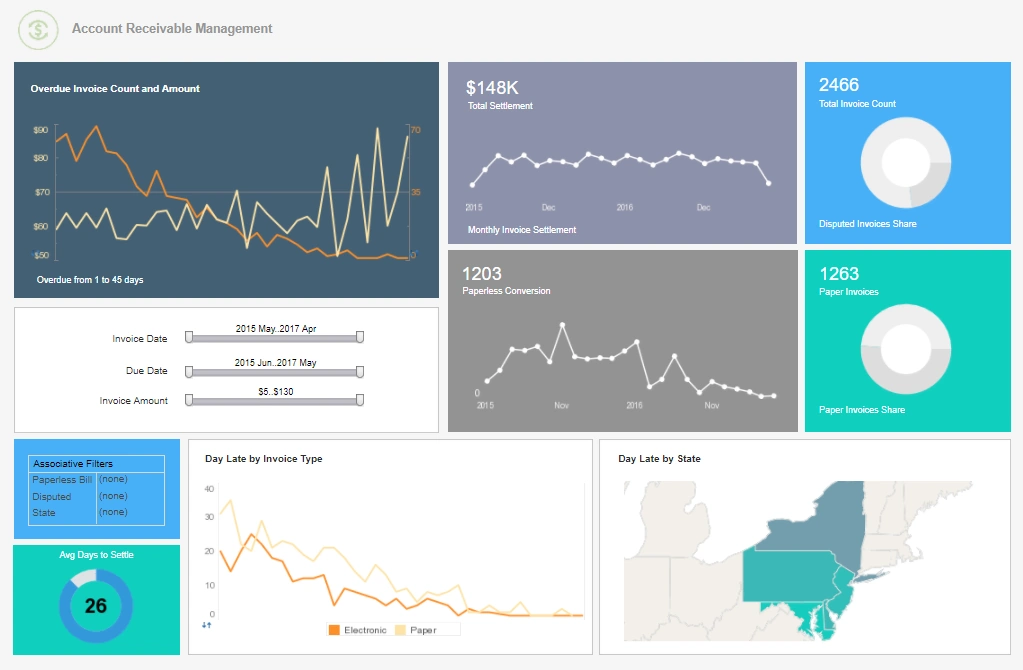
Finance
Finance departments are challenged everyday with more reporting demands by executives, boards, and external agencies. This diverse audience also increasingly wants more transparent and quicker responses. CFOs want deeper analysis to discover opportunities and insights. Visualization dashboards with rich interactive functions provided by a BI solution empower finance professionals with unprecedented self-service information and exploration. This, in turn, minimizes follow-up explanations otherwise needed by information consumers.
Machine learning provided by an effective BI solution can use archived data for forecasting, the discovery of irregularities, and for auditing. This not only saves finance professionals precious time but also delivers findings that are hidden in data. A BI solution can produce pixel-perfect document reports suitable for dual online and offline use. Online reports provide modern interactive functions such as streaming, searching, zooming, filtering, drilling, and social sharing. Offline reports can be distributed in a variety of formats suitable for printing, digital archiving, and auditing.
Finance must interface to systems that run the business on a day to day basis, such as general ledger, accounts payable, accounts receivable, sales, invoicing, etc.
Finance also has to be involved in planning, budgeting, and forecasting. The field of “performance management” fuses planning and budgeting with business intelligence. Over the past ten years finance has focused on the operational systems by implementing ERP systems in order to get process standardization and speed up the transactional part of finance. Now finance departments are shifting their focus and energy towards using intelligence and analytics to become more effective. As the move happens in the marketplace now, the real opportunity is to analyze where spending is occurring and where the business is getting the value from. This is the insight that will drive the business.
For a long period of time, spreadsheets have ruled finance, providing not only the analysis tool, but also effectively the data management system. Now, there’s nothing wrong with spreadsheets. Spreadsheets are very powerful, but the complete reliance on spreadsheets undermines the information consistency of the enterprise. CFOs have now recognized that this is certainly not a secure controllable environment for managing the financial information of the company.
Efforts have been made in the direction of securing this environment, perhaps even eliminating spreadsheets for external and statutory reporting. In reality however, spreadsheets are not the proper tool to use as a data management system for collecting, gathering, integrating, and disseminating information within the company. The right tool for this is a BI system.
Finance also needs to access data from every other function, from the CRM system, to the supply chain system, to the transactional and operational databases, and even marketing and HR systems. Ultimately all of this information needs to be mashed up to get the whole picture.
Travel
Millennials will soon make up the majority of the workforce. They commonly plan their trips with their smartphones, trust AI to make critical analytical decisions, digitally manage their expenses, embrace and learn new technologies, etc. In the last few years, traveling has been associated very strongly with risks such as exposure to viruses, supply chain weakness, energy costs, changes in regulation, natural disasters, terrorist attacks, etc. These are the commonest disruptors that prevent business travelers from getting to their destination in a timely manner and can also pose danger to life and health.
Organizations use BI solutions to streamline travel risk management, by using real-time alerts to keep travelers up to date, and by collecting historical data of past risks and disruptions.Organizations may also be responsible for looking after their partners and contractors when they travel on the company's behalf. A BI solution can provide tools to monitor and communicate with these partners and as if they are the company employees.

Marketing
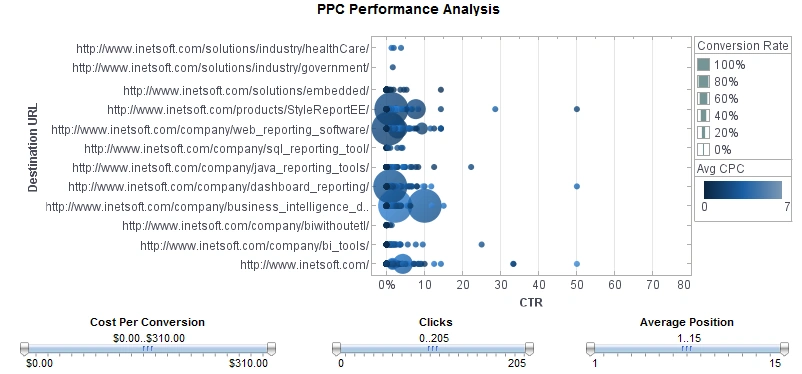
Marketing dashboard software is crucial for analyzing a marketing department's leads, progress, and traffic. Software is particularly useful to marketing professionals when it comes to measuring the effectiveness of digital marketing campaigns, tracking the performance of blog posts, external website links, and search engine rankings. An effective BI solution allows marketers to create web-based interactive dashboards that can take the viewer from a high-level view of marketing performance down into the details for further investigation. Advanced visualization allows for further analysis and multidimensional exploration of data.
A modern BI solution should provide instant connectivity to Google Analytics, Google Adwords, Salesforce.com, and a host of other marketing-oriented data sources, to make it easy to measure KPIs such as total cost per lead, incremental sales, website bounce rates, average lead scores, and more. With a versatile and customizable BI solution, analyzing the engagement of website visitors and potential leads should be easy. Interactive visualization should make it easy for marketing professionals to analyze various data in dashboards, visualizing metrics such as engagement on social media, and the success or lack thereof of pay-per-click advertisements.
Marketing users who lack a technical background should be able to build interactive marketing dashboards without help from IT. BI software provides the opportunity to mash up marketing data from a variety of sources to provide a unified view of corporate progress. Data mashup is useful for creating various marketing KPI’s, because it makes merging data from various data sources easy and effortless. For example, users should be able to drag-and-drop lead acquisition data from Google Analytics and mash it up with opportunity data from salesforce.com or any common CRM. These mashup-driven dashboards should be shareable and distributable across the company, allowing all team members to be on the same page.
Marketing KPI’s such as email marketing engagement scores, net promoter scores, or number and quality of backlinks can all be thoroughly investigated through filtering, highlighting, and brushing. These tools allow for the studying of a specific aspect of the marketing data on the dashboard or report. You can, for instance, see how far you are in terms of content. Does your team have enough time to produce and publish the required amount of content? Quickly discover whether you will need to hire freelance experts from apaper writing service. Determine whether you have enough social media accounts under your control and how active they are.
BI software should be mobile-friendly and work on any web-browser or phone, making it more accessible and versatile. With all the dashboards viewable through the click of a button on a phone, users never need to be out of touch with marketing progress.
A marketing dashboard displays plenty of indicators and metrics that a marketing specialist should know and interpret. The key idea is to analyze the reports in the shape of heat maps, scatter plots, and other visuals to decide how to improve the current activities and results. Key provided by most BI marketing dashboards include lead-to-cashflow, prospects, profitability, conversion rates, geodata, source tracking (e.g., organic search).
To get the most accurate results, experts recommend tracking the activities of all possible sources where your business is present: automation platforms, websites, social media accounts, email campaigns, etc. BI solutions provide customizable dashboards that you can adapt to your own marketing needs.
Project Management
Project managers foremost need project progress and coordination information such as dashboards displaying Gantt charts. However, the dashboards must be able to go beyond core project management data to give a holistic view of all factors that can impact on-time, on-budget delivery. For successful delivery of projects, project managers must utilize all project-related data, for example, supply chain and issue tracking system data. These systems are normally scattered. Some third party data may even be in Excel files. BI mashup features makes data processing a light-weight, business user self-serviceable process with great efficiency.
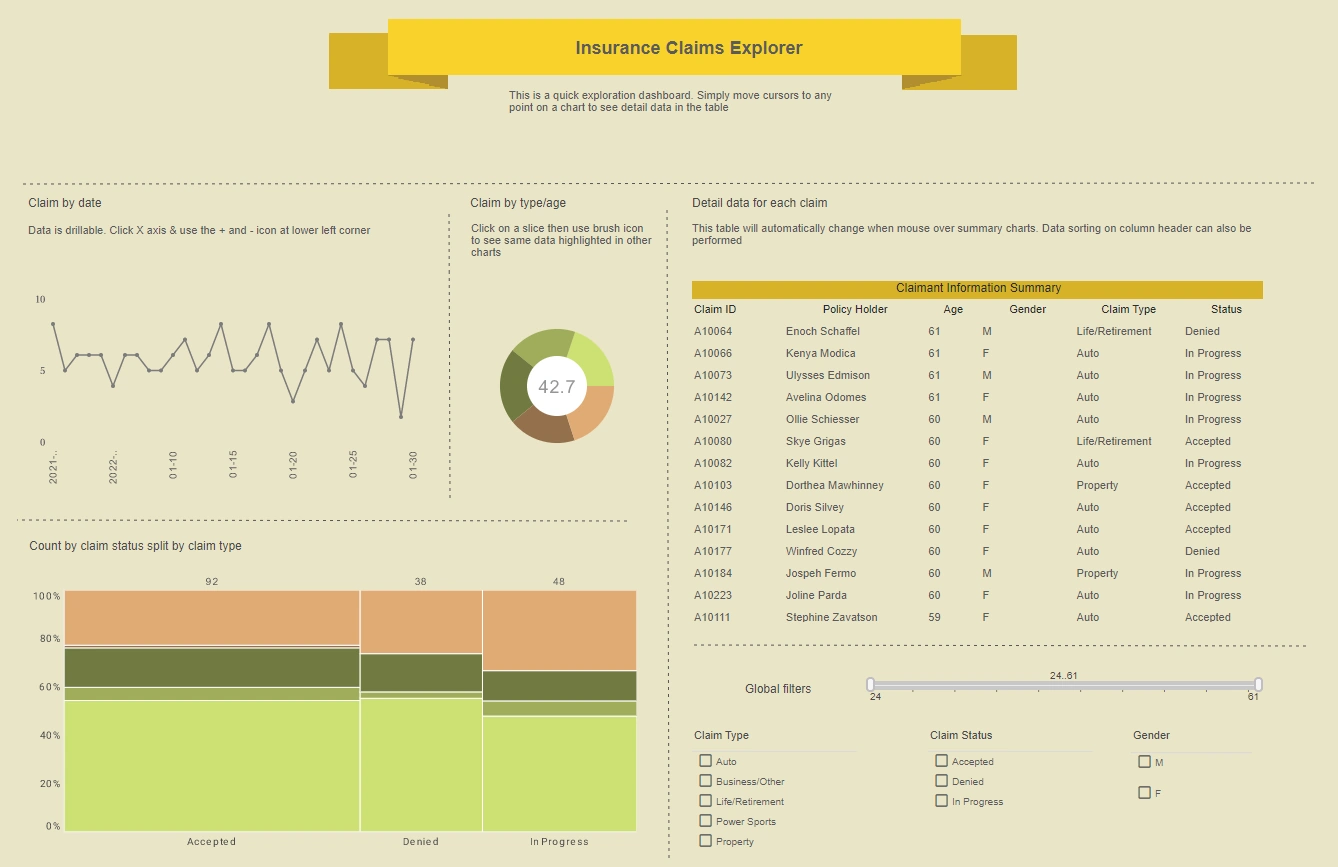
Claims
A claims department of any kind must handle large amounts of data, generally from diverse sources. In the case of medical claims, data is generated from patients, physicians, medical institutions, laboratories, and other sources. A BI solution can synthesize data from these diverse sources to produce a coherent picture that can help a claims department to assess costs and revenues associated with various parties.
A claims dashboard, for example, can break down claims by age, gender, status of claim in pipeline, and can allow an analyst to drill to any level of detail, whether this relates to patient or doctor data, or to third party labs or medical equipment providers. Links can even target supplier partner and supplier websites to list services and providers available for a given user or patient.
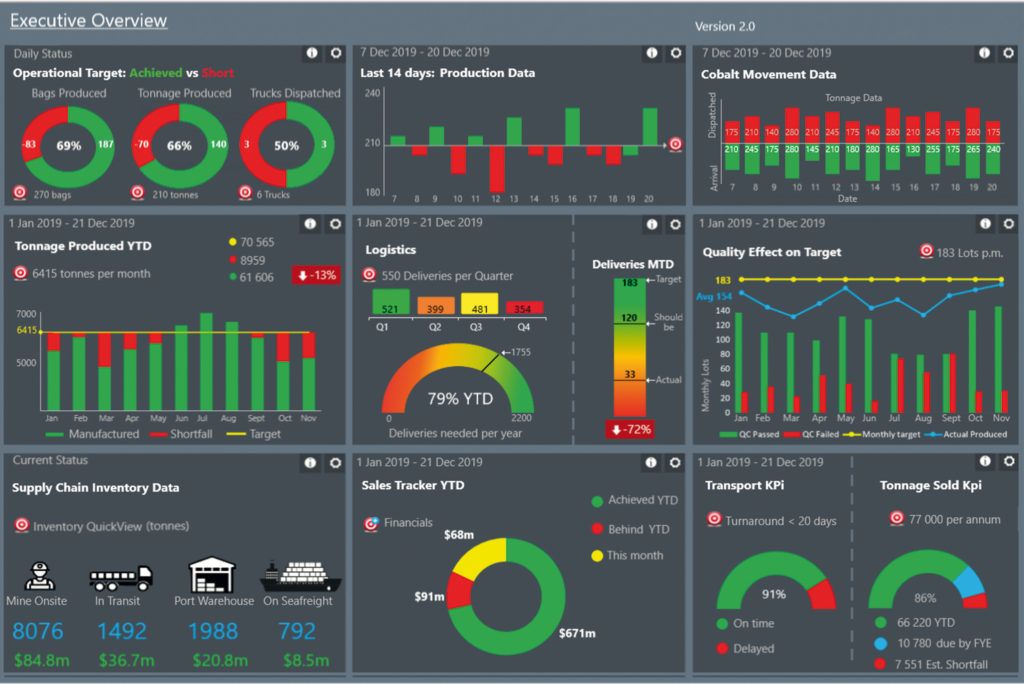
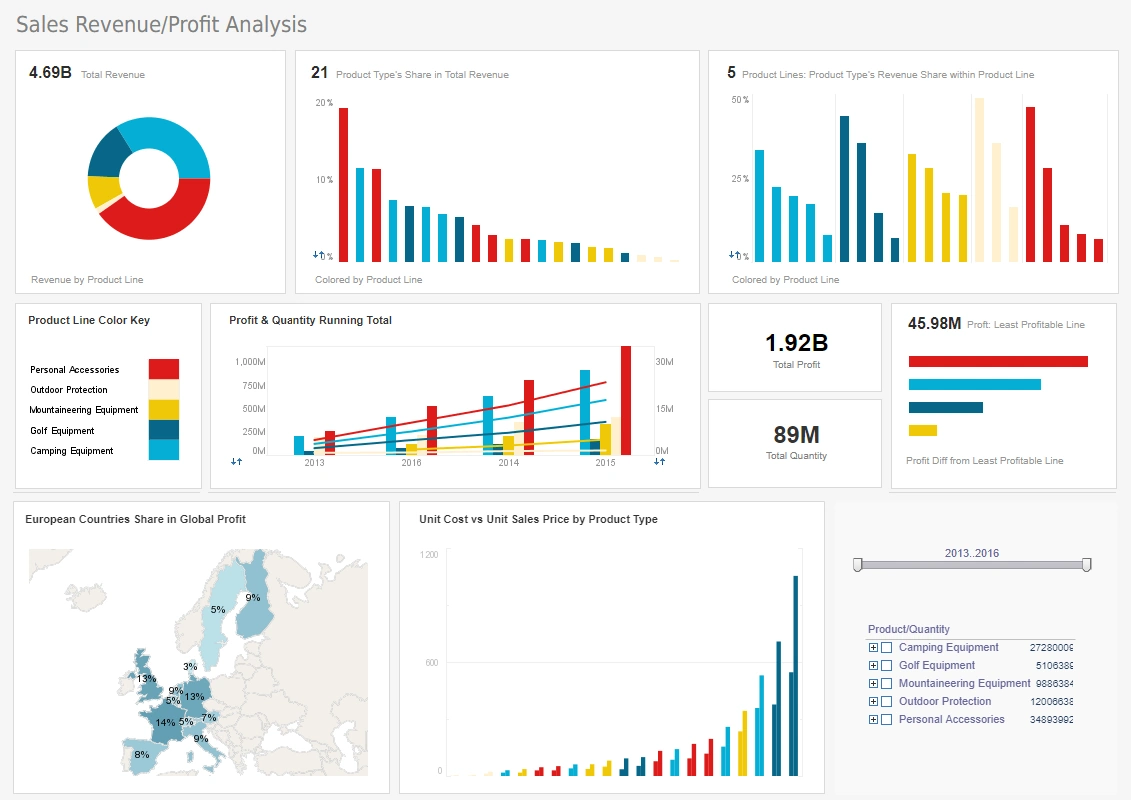
Production
Manufacturing processes generate volumes of data that must be monitored and analyzed for peak performance and efficiency. By observing and analyzing these processes, companies can gain an understanding of the different shifts and trends which help and hinder their business. This knowledge provides managers with great insight to act accordingly and make decisions in a confident manner.
A BI solution should provide a manufacturing or production department with dashboards that graphically represent the status of each phase of the manufacturing process using appropriate display elements such as charts, tables, diagrams, spreadsheets, etc., which are highly interactive and easily deployed. Managers should be able to easily track the number of goods being produced without error, delays caused by machine downtime, errors caused by workers, violations of safety procedures or work-related injuries. A BI system should also be able to project forthcoming manufacturing demand based seasonality, recurring and new orders, and so should be able to integrate with a companies sales databases to anticipate manufacturing demand and to be alerted as early as possible to customer returns that might indicate a faulty production batch.
A BI system gives workers and managers the ability to communicate and monitor their activity, as well as receive real-time alerts of under-performance or deviations from plans. The business then has the advantage of being able to grow and develop manufacturing capabilities with full knowledge of expected demand and their own manufacturing parameters.
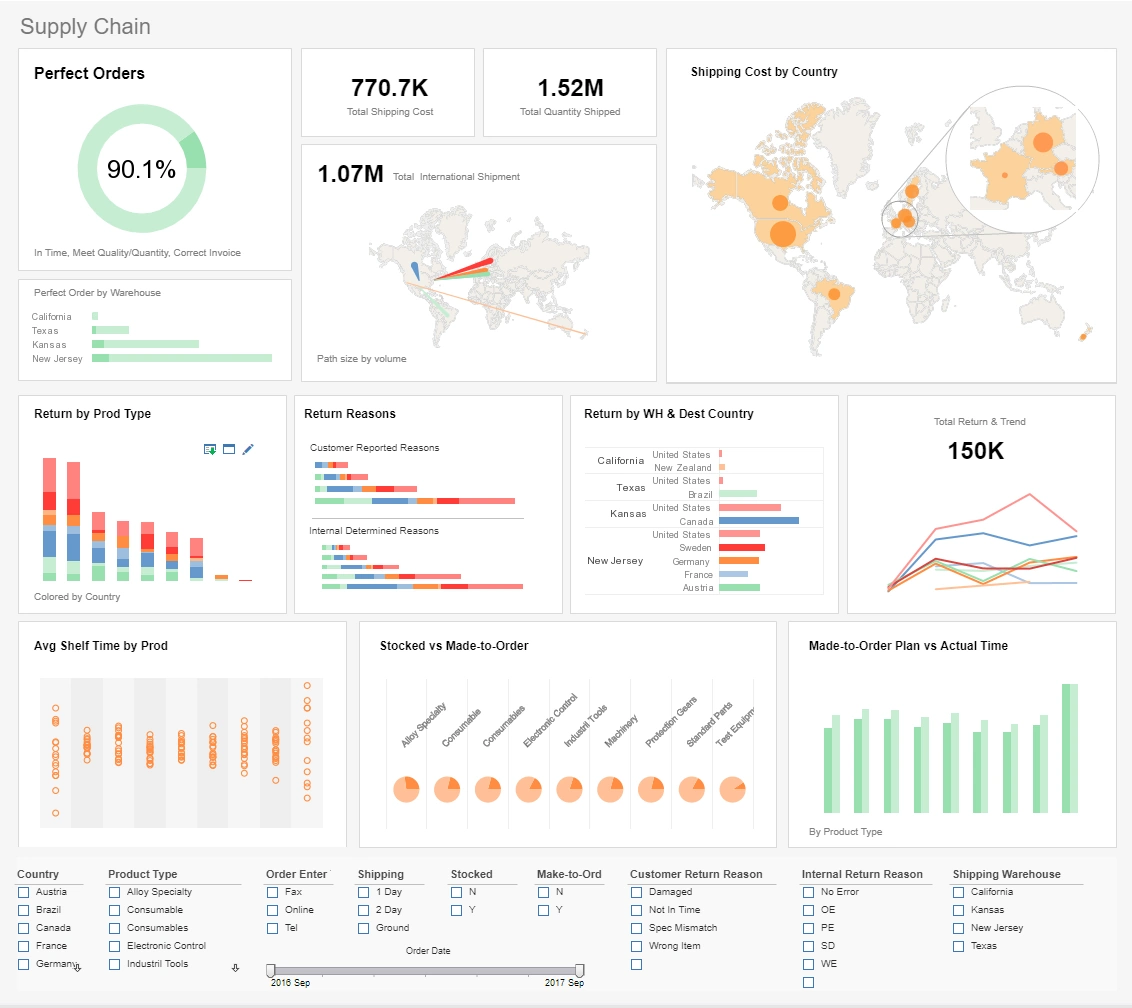
Supply chain management in particular has become a complex process of coordinating many moving parts. Just-in-time manufacturing and globalization have created challenges that cannot be addressed within a single organization. Data-driven supply chain management becomes a requirement for maximum efficiency. BI dashboards can not only present a unified view of the supply chain as intuitive visualizations, but can provide instant access to powerful business analytics through real-time interactivity and customization.

Big data and BI technology helps companies focus more on things like improving delivery times, reducing the communication gap between manufacturers and suppliers, allowing management to monitor performance to improve productivity, facilitating data-driven decisions to reduce costs and improve service levels. Big data analytics enhances many aspects of production, distribution, and supply chain management.
-
Product traceability: It's important to have product traceability in your supply chain operations. Supply chain managers should be able to easily trace a product by using barcode scanners and radio frequency identification devices. Big data and BI allow businesses to gather accurate product information, so that operators can carry out a successful distribution cycle from production to retail.
-
Risk analysis: Big data and BI ensure that supply chain analytics determine the unknown and known risks. BI analytics can forecast future risks by identifying patterns and trends that occur within the supply chain.
-
Sourcing optimization: Big data and BI allow you to connect all status and pricing data from vendors worldwide.
-
Data security: Big data and BI allow you to keep data in the cloud, improving security, redundancy, and availability. By storing data in the cloud, metrics can be unified and updated in real time, providing real-time alerts that notify supply chains on gaps and issues, organizing vendors, detecting materials with consistent quality issues, eliminating unnecessary processes.
-
Inventory management: Big data and BI allow operation managers to get a real-time overview of operations and identify anything that might be hindering supply chain processes.
-
Consumer patterns: Big data and BI provide insight into consumer behavior and usage patterns.
-
Streamlined fulfillment: Fulfillment analytics can help maximize revenue and retain customers by having supply chain management look at both customer fulfillment and the warehouse itself. This allows management to formulate the final steps of production.
-
Future projects: Big data and BI can help businesses see what's to come in future projects. Companies can leverage analytics to process both unstructured and structured data, and formulate predictions on what can happen if something goes wrong, or what's to come based on any trends and issues, thus reducing risks inherent in new projects.

Features to Look for in a Good BI Solution
This section discusses the key features that a business should consider in choosing a BI solution.
-
Data Connectivity: A BI solution’s data engine should be able to access any data source, from spreadsheet files to relational databases, data warehouses, big data storages, all the way to on-premise or cloud-based applications that use JSON and REST APIs. The daata engine must be able to handle “big data” applications and be fully scalable to meet changing demands. The solution should multi-tenancy features to allow automated parameterized connection to multiple databases or schemas based on user, group, or role, and should facilitate creation of business-friendly abstraction layers such as entity-attribute models in addition to supporting graphical user-friendly SQL query creation.
-
Data Mashup: The BI solution should be able to aggregate and federate data from connected data sources via standard data operations such as joins and unions, and facilitate mashup operations without requiring programming.
-
Machine Learning: A BI solution should give business users direct access to machine learning models, to quickly productionalize models that have succeeded experimentally. Machine learning output should be readily mashed up with human designed analysis.
-
Self Service: A crucial component of an effective BI solution is self-service capability for business users. A BI solution should not require users to be experts in databases or report writing. Rather the BI solution should enable ordinary business users to connect to data, create sophisticated and beautiful and report and dashboards, and distribute these assets in a wide variety of formats on a broad set of platforms and devices, all without requiring the involvement of IT or engineering personnel.
-
Interactivity: While reports will always be an important part of communicating data to business users, a modern BI solution must provide highly interactive dashboards that allow real-time data exploration for huge and complex data sets. Dashboards must feature ability to filter and drill into data, display data using a variety of methods such as tables, charts, crosstabs, text, gauges, sliders, etc, provide customizability with easy-to-use design tools and CSS, facilitate date comparison of historical data and projection of future results, support the use of multiple tabs and pages, interactive forms, hyperlinks, conditional formatting, and provide easy access to implement scripted logic for full customization.
-
Automation: A BI solution should provide extensive automation efficiencies at all levels, from automated data source connection and data caching and updating, to automated data joins and mashup, wizard-based guidance for report and dashboard creation, scheduling for batch report and dashboard distribution with full parameterization, automated alerts for key data events, and automated distribution of reports.
-
Customizability: With the acknowledgement that not every possible need and application can be anticipated and provided as “out of the box” features, a BI system must provide expensive ability for customization via relevant APIs, such as Java API, REST API, web APIs, and be fully scriptable with programmed logic at all strata, all the way from the database level to to behavior of individual charts, tables, and text. This provides the flexibility a BI solution needs to easily meet future challenges that have not yet even been anticipated.
-
Scalability: A BI solution must be chosen not only on its ability to meet today's needs but for its ability to scale smoothly for challenges that may be faced in the next months or years, including added users, additional data sources, higher uptime demand, and so on.

An effective business intelligence solution can quickly bring benefits in productivity, cost, quality, and reliability to almost any organization or department. When an organization chooses a business intelligence solution that meets all of the criteria listed above, they can be confident that their systems and processes will have these benefits of business intelligence both immediately and well into the future.