InetSoft Product Information: Analysis Functions
InetSoft provides a broad and unusually deep set of analysis functions designed to support exploratory analytics, operational reporting, and advanced decision support within a single platform. Rather than treating analysis as a bolt-on feature layered on top of charts and tables, InetSoft treats analysis as a core capability that spans data preparation, calculation, visualization, and interaction. This approach makes the platform particularly effective for teams that need both flexibility and rigor without relying on multiple disconnected tools.
Calculated Fields and Expressions
One of the foundational analysis capabilities in InetSoft is the use of calculated fields. These allow users to define new metrics derived from existing data using arithmetic operations, conditional logic, and built-in functions. Calculated fields can be created at the data source level or directly within reports and dashboards, depending on the scope required.
Expressions support numeric, string, and date operations, making it possible to construct business-specific KPIs such as margin, utilization rates, conversion percentages, or time-based performance indicators. Because calculations are reusable and centrally managed, they promote consistency across dashboards while still allowing customization where needed.
Aggregation and Grouping Functions
InetSoft includes robust aggregation functions that enable meaningful summarization of data across dimensions. Standard functions such as sum, average, count, min, and max are available, along with more specialized aggregations like distinct counts and weighted averages.
Grouping can be applied across one or multiple dimensions, enabling multi-level summaries such as performance by region, product category, and time period. These functions are essential for transforming raw transactional data into insights that align with how organizations actually operate and make decisions.
Time Series and Date-Based Analysis
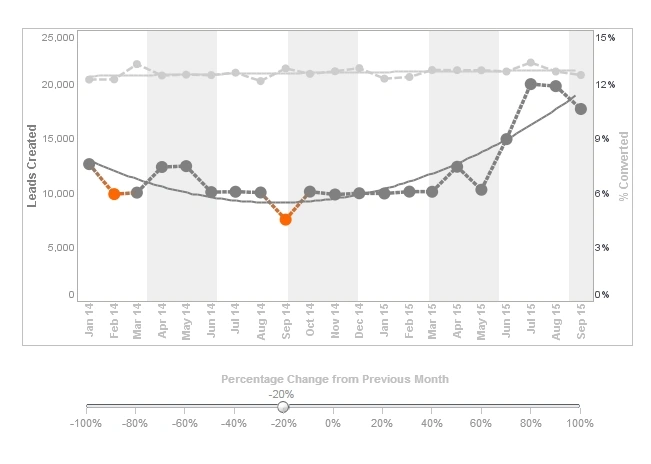
Time-based analysis is a major strength of InetSoft. The platform includes built-in date functions that support year-over-year, period-over-period, rolling averages, cumulative totals, and trailing window calculations. These functions make it easier to analyze trends, seasonality, and growth patterns without requiring complex SQL or external preprocessing.
Time intelligence functions can be applied dynamically, allowing users to adjust time granularity from days to weeks, months, quarters, or years. This flexibility is particularly valuable for financial analysis, operational monitoring, and executive reporting.
Filtering and Conditional Logic
Analysis in InetSoft is heavily driven by filtering capabilities. Filters can be applied globally, at the dashboard level, or to individual components. Conditional logic allows filters to respond dynamically to user selections, parameters, or data values.
Advanced conditions enable scenarios such as threshold-based alerts, exception reporting, and segmentation analysis. For example, users can isolate underperforming regions, customers above a revenue threshold, or transactions that fall outside expected ranges.
Statistical and Analytical Functions
InetSoft includes a range of statistical functions that support deeper analysis beyond simple aggregation. These functions include variance, standard deviation, percentiles, and ranking. Such capabilities allow analysts to evaluate distribution, volatility, and relative performance within datasets.
Ranking and sorting functions are especially useful for identifying top and bottom performers, detecting outliers, and prioritizing actions. These analytical features elevate dashboards from descriptive summaries to diagnostic tools.
Drill-Down, Drill-Through, and Data Exploration
Interactive exploration is a core analytical function of InetSoft. Users can drill down from summary metrics into progressively more detailed views, moving from high-level KPIs to underlying transactions. Drill-through capabilities enable navigation across related datasets, such as moving from a sales summary into customer or product detail.
This interactive model encourages investigation rather than passive consumption. It supports real analytical workflows where questions evolve as data is explored, rather than being predefined at design time.
What-If and Scenario Analysis
InetSoft supports what-if analysis through parameterized calculations and user-driven inputs. Users can adjust assumptions such as pricing, growth rates, or resource levels and immediately see the impact on downstream metrics.
Scenario analysis is particularly valuable for planning, forecasting, and budgeting use cases. By embedding these capabilities directly into dashboards, InetSoft allows decision makers to test hypotheses in real time without exporting data to spreadsheets.
Parameterized Queries and Dynamic Filters
InetSoft supports parameterized queries and dynamic filtering that adapt based on user input or context. This allows dashboards and reports to respond intelligently to changing conditions without requiring manual reconfiguration.
Parameters can control data scope, calculation logic, or visual presentation. This makes dashboards more versatile and reduces the need for multiple versions of the same report tailored to different audiences or scenarios.
Data Mashup and Cross-Source Analysis
A defining analytical function of InetSoft is its ability to mash up data from multiple sources. Relational databases, cloud applications, flat files, and APIs can be combined into a unified analytical model. This makes it possible to analyze relationships that would otherwise remain siloed.
Cross-source analysis enables use cases such as combining CRM data with financial systems, blending operational metrics with survey results, or correlating usage data with support tickets. The analytical value of these mashups often exceeds that of any single source in isolation.
Visual Analytics and Pattern Recognition
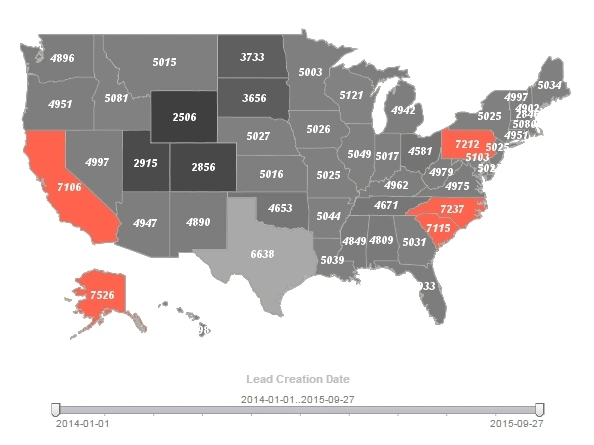
Analysis in InetSoft is tightly integrated with visualization. Charts, heat maps, scatter plots, and geographic views are not just presentation elements but analytical tools that reveal patterns, correlations, and anomalies.
Visual analytics functions allow users to spot trends quickly, compare distributions, and identify relationships that are difficult to see in tables alone. This visual-first approach aligns well with how humans interpret complex data.
Security-Aware Analysis
Analytical functions in InetSoft respect data security and access controls. Calculations, filters, and drill paths are automatically constrained by user permissions. This ensures that insights are accurate and compliant, even when the same dashboard is used across different roles.
Security-aware analysis reduces the need for duplicated reports while maintaining trust in the data. It also enables self-service analytics without sacrificing governance.
Why InetSoft’s Analysis Functions Stand Out
What distinguishes InetSoft is not any single analytical function but the way these capabilities work together. Calculations, filtering, visualization, and interactivity are part of a unified analytical experience rather than separate features. This coherence makes it easier to move from question to insight without technical friction.
For organizations seeking a platform that supports both structured reporting and open-ended analysis, InetSoft’s analytical functions provide a strong balance of power, usability, and scalability.
3 Pillars of Data Analytics - Every business needs a strategy to function with gain maximum profit as well as sustain itself in the market. More than earning a profit, sustaining in the market is a big matter these days. Therefore, it is a must to use the latest data analytics techniques instead of just relying on the data available. Advanced data analytics comprises three pillars namely speed, agility, and performance which are important to utilize the full potential from it. These pillars strengthen the analytics strategies themselves and improve your business multiple folds. The three pillars of data analytics are: Speed Agility Performance. As we mentioned earlier, you cannot depend just on the available data and take a decision for your business. Rather you have to incorporate the latest data analytics techniques to get real-time data on the market situation and devise a strategy accordingly. This kind of data analytics cannot be done with a usual CPU. Because the machines performing the analytics has to take up a lot of input data and process them using several mathematical tools to achieve results...
4 Ways How Credit Unions Use Dashboards and Analytics - Like many other businesses now, many credit unions are struggling with continuous technology adoption and innovation. Some may find themselves behind on many important technological trends and face increasing concerns such as cyber security issues, fintech solutions, and marketing challenges. To survive and thrive in the ever-changing banking industry, credit unions need to invest in the latest industry technology. Not only does this strategy provide a competitive advantage, but it also helps with attracting young talent and improves the ability to adapt to constantly changing market standards. Business Intelligence (BI) solutions like dashboards and data analytics are some of the most interesting technology investment options for credit unions. Powered by machine learning, these solutions allow to get insights from current and historical business data and make sound predictions about the future. Businesses around the world are investing in these solutions; in fact, the global BI and analytics software market is set to increase by at least $3 billion between...
5 Inspiring Examples of Data Intelligence Marketing in Action - How you can use data to enhance your marketing strategy. Data analytics and marketing make a perfect match-but many businesses aren't merging the two disciplines. While plastic banner ads and one-size-fits-all messaging were once the order of the day, in our hyper-connected modern age, consumers command far more when it comes to investing in a brand or a business. Niche, product, or industry aside, to connect with your target audience on a personal level, inspire customer loyalty, and accelerate your commercial growth, taking a data-driven approach to your marketing campaigns is vital....
5V's of Data Analytics - The process of reviewing and analysing data in order to extract insights and make educated decisions is referred to as data analytics. It entails collecting, processing, and analysing data from multiple sources, including as databases, spreadsheets, and internet platforms, using a variety of methodologies and tools. The 5V's of Data analytics are: Velocity Volume Variety Value Veracity. Volume refers to the amount of data present in the database. The value of the data is determined by its size. When you have an enormous amount, it is considered big data. It is also relative to the computing power available. But generally, Data analytics is founded upon the presence of a large volume of data without which it is impossible to create advanced models for machine learning or AI. The tech world is progressing toward AI which requires processing, learning, and understanding huge volumes of data. Companies trying to beat their competitors must have such data to develop and use advanced analytics. The speed with which data is being accumulated and accessed refers to the Velocity. In this tech era, you can find huge amounts of data flowing in and out every day. This continuous flow of data must be quick so that it is available for businesses to use to their advantage at the right time. The market situation is highly competitive which demands creating timely strategies. This can only be possible with the help of big data...
6 Phases of Data Analytics - Data analytics is the process of looking at and analyzing data to draw conclusions and make wise judgments. In order to gather, process, and analyze data from diverse sources, including databases, spreadsheets, and internet platforms, a range of approaches and technologies are used. To make data-driven decisions and optimize operations, data analytics is employed in a range of industries, including business, finance, healthcare, and government. The six phases of data analytics are: Ask Prepare Process Analyze Share Act. Every data analysis is done to solve a problem. But you cannot choose a proper model without understanding what the problem is. Therefore, the first phase in data analysis begins with asking the right set of questions to recognize the problem. Without understanding the problem, you cannot come to the correct resolutions. Also, finding the problem might be one of the difficult tasks. Here are some guidelines to identify the problem by asking the right questions...
Achieving Analytic Agility with Data Mashups - The need to react quickly to a rapidly changing business climate is forcing organizations to make faster business decisions. But being able to quickly ask questions and get answers is not a simple task. While business intelligence (BI) tools and applications have emerged as viable solutions, traditional approaches to building and deploying these systems are complex, cumbersome, and expensive and often fail to keep pace with BI end-user demands and expectations. More often than not, resource-constrained IT departments are overburdened with BI requests, sometimes taking days, weeks, or months to fulfill them. The challenge is to deliver a BI system that breaks the mold of traditional BI solution deployments by removing this IT bottleneck and shifting the analysis to business users. What's needed is a more agile approach that allows business users to self-service their BI needs. Ovum believes a key enabler for achieving self-service BI agility is data mashup technology...
Acting on the Findings from Discovery Analyses - How do users act on the findings from discovery analyses? How do users act on relationship findings from discoveries that may require further software implementation work or require further visualization? So in our world, you do the discovery and analysis, and you can do several things when you reach a selection state you’re interested in. You can export the charts into PowerPoint, Word, PDF, or Excel, as we saw in the one example. You can export also the rows and columns from any of the tables and memories out to a .csv file which can then be imported into anything else. So we do have customers who will link the analysis results to their other reporting systems. We have customers that have linked these things through to control systems so, for example, if you find, say problems and you want to pass that information back to your planners, you can connect that right back into the operating systems to do that. So I think that’s answer to the question. We’re trying to be a discovering analysis tool that connects with the rest of the world you operate in whether it’s Microsoft Office so you can make presentations or whether it sending data to another system...
Ad Hoc Report Analysis - Style Intelligence™ ad hoc reporting tools enables users to analyze multidimensional data from multiple perspectives. Construct your ad hoc analysis using quick and easy access to data from an original report. Users can immediately access data by using a point-and-click interface. This cuts down asking different divisions and/or departments for separate data in a pressing situation.

Adobe Analytics Dashboard Software - Take the depth and breadth of Adobe Analytics and harness the intuitive agility of InetSoft's robust software available to you in digital marketing dashboards! Over the years, InetSoft has continued to meet the demands of the BI field, solving connectivity and blending issues by continually adding connectors for new data sources, both in cloud and on premise. Bringing the best and latest software service tools to the market with on-demand, flexible and embedded features, it makes InetSoft a one-stop-shop for all your operational needs...
Adobe Analytics Dashboarding Tool - Looking for a good solution for Adobe Analytics dashboarding? InetSoft's pioneering BI application produces great-looking dashboards that mashup your eCommerce data with other marketing data in your organization. View a demo and try interactive examples...
Advanced Analytics - Its Definition and Current State - How do we define advanced analytics? Well, advanced analytics, you can think of it as the deeper dive, a type of more ad hoc analytics that you don’t necessarily know ahead of time. that you haven’t necessarily standardized. As opposed to say a typical BI environment where you have standardized reports. They may have some prompts or options, but they’re pretty well boxed in and canned and standardized. The advanced analytics is when you start to get into deeper dive ad hoc analytics, all the way up and including data mining, predictive modeling, trying to really get more proactive, predicting rather than retroactively reporting. So what we see as the tie between the two is that as you look at a standardized report in a BI environment, you might see an anomaly, positive or negative that you want to learn more about. That could kick off some advanced analytics to dig under, diagnose what’s causing it. Is that a good or a bad thing? What might you do next? At the same time you might start with something that’s an ad hoc analytic to begin with. Data visualization is pretty valuable, and over time you could end up transitioning the results into a reporting environment once that logic is defined. So advanced analytics and BI are distinct but inter related, and if they’re both used appropriately, you can get more from both those areas than you would individually...
Agricultural Analytics Dashboard - Agriculture has gradually transitioned from traditional experiential models into the digital era, and our agricultural dashboard stands as your powerful tool for enhancing crop yield. The InetSoft Agricultural Analysis Dashboard is designed to provide you with a comprehensive understanding of global agricultural production and crop yield in different nations....
Amazon Aurora Analytics Tool - Do you need help making sense of your Amazon Aurora data? Amazon Aurora is a relational database service developed and offered by Amazon Web Services beginning in October 2014. InetSoft's software can access Amazon Aurora, as well as various Big Data sources from anywhere, making it easier to manipulate data because it's all in one place...
An Alternative to Qlik Sense - Selecting Business Intelligence (BI) solutions for an organization is hard, risky, and inherently biased. But the process is made easier by the G2 Crowd review platform with its real-time, transparent and unbiased user reviews. This helps an organization to objectively assess what is best by leveraging the wisdom of the crowd, limiting the risk, and finding out what works. The reviews are validated by G2 Crowd thereby helping organizations make better buying decisions...

Analyses That a Cardiologist Does - Cardiologists are medical specialists who focus on diagnosing and treating diseases and disorders of the heart and blood vessels. They perform a wide range of analyses to assess cardiovascular health, evaluate cardiac function, and manage cardiovascular conditions. One common type of analysis conducted by cardiologists is diagnostic testing, which includes electrocardiography (ECG or EKG), echocardiography, stress testing, and cardiac catheterization. These tests provide valuable information about heart rhythm, blood flow, cardiac structure, and function, helping cardiologists diagnose conditions such as arrhythmias, coronary artery disease, heart failure, and valvular heart disease. In addition to diagnostic testing, cardiologists use risk assessment tools and algorithms to evaluate patients' risk of developing cardiovascular diseases and assess their overall cardiovascular health. They analyze various risk factors, including age, gender, family history, smoking status, blood pressure, cholesterol levels, diabetes, and obesity, to stratify patients into different risk categories and guide preventive interventions. By identifying individuals at high risk of...
Analysis and Reporting for OLAP Cubes - InetSoft's analysis and reporting software can access OLAP cubes and many other data sources. The business intelligence application, StyleBI, supports popular OLAP servers such as Microsoft SQL Server Analysis Services, Hyperion Essbase, and SAP NetWeaver...
Analysis Software - a description of the benefits of InetSoft's analysis software, how it is easy to deploy and easy to use. How it can be deployed in weeks, not months, learned by new-users with minimal training. The visual analysis capabilities of InetSoft's software enable replacing dozens of individual reports or static charts with a single interactive analysis screen...
Analysis Tools for Business - A major goal of InetSoft is to empower end-users with maximum self-service. Since1996, InetSoft has strived to provide customers with unrestricted access to BI technology and has challenged the false practices and obstructions that previously hampered acceptance of BI software by many companies...
Analysis Tools - a description of the benefits of InetSoft's analysis tools, how they are easy, agile, and robust. How they satisfy different business users and fulfill the demands of power users
Analytic Reporting Tools - Searching for Analytic Reporting Tools? InetSoft's StyleBI includes easy-to-use analytic reporting tools, enabling users of diverse technological backgrounds...
Analytic Date Comparison Features - Next is an update to our Date Comparison features. This update facilitate flexible comparisons of different date groupings. A lot of custom date comparisons which previously required going into the data worksheet can now be done entirely within the dashboard. Our Enterprise Manager Task Scheduler has been updated, you can now schedule tasks by groups of users, instead of having to add individual users each time. While designing in Visual Composer, we now have a console that will capture high level warnings and errors as they happen during design...
Analytic Software - A description of the benefits of InetSoft's analytic software, what distinguishes InetSoft from other analytic software. Multi-dimensional analysis with coloring and sizing make pattern and outlier identification easy, and filter boxes, selections lists, and drop-down menus pack access to loads of data from one well-built analytic view...
Analytic Software Vendors Have Improved Interfaces - And I think some of the analytic software vendors have improved interfaces to facilitate this trend towards less specialized users doing data mining. The number of people who are statistical analysts has not increased in recent years, but the demand to apply predictive analytics to business or government domains has increased dramatically. And as this new group of people has become involved, they have required simpler user interfaces. They have worked collaboratively, to achieve better outcomes working together. They may have been tapped into for business knowledge, but they didn’t really understand how predictive analytics works or how you get a lot of value out of the data, what the process is. Now that they are more hands-on, and the simpler interfaces are available, things have really changed. I think that that is in a sense, a best practice, if you want to get more transformative results. Moderator: Let's focus on the other side of best practices, if you will, worst practices, what are some of the biggest mistakes that you have seen people make when either launching a data mining program...

Analytic Tools - A description of the benefits of InetSoft's analytic tools that are simple to use and deploy. Self-service extends from the data access layer where analysts or power users can assemble the data blocks they want to use, mashing up data from disparate data sources, even if they were not previously modeled by a database analyst or BI admin, to the visualization creation and editing, where a drag and drop WSYWIG editor is easy enough for the average business user who is familiar with Excel and PowerPoint...
Analytical Tools Examples - Is your company's data too big and complex to understand? InetSoft is your solution! With InetSoft's analytical tools, you can expect fresh new insights that will increase both the internal and external performance of your organization...
Analytical Challenges - First and foremost is the culture of analytics cannot thrive in a culture that is not conducive to it. And by that I mean the culture has to be fact-based decision making driven from the top. Where executives understand the value of information, they use information to validate their decisions, validate their instinct. Or vice-versa, they go with their instinct or use the data to make decisions, and use their instinct to validate those decisions. There is a lot to be said there but we are not going to dwell on that today...
Analytical MDM Platforms - New releases in the technology have advanced it to be a true enabling operational and analytical MDM platform. I think that the state of the technology is there are a lot of vendors in the marketplace who initially went out with an application to try to solve a specific niche problem. Those were the ones who have a CDI product, or the ones that have a PIM specific product. They are realizing that the market is evolving where cross-domain data management is what people want. They want to start with CDI and then move to a product or move to a supplier, etc., etc. So the platforms now need to be able to support those cross domains. And the reality is in most MDM implementations, it's not like I am going to bring an application, and immediately it’s in place, and it's up and running. Because of the nature of the business rules and business processes associated with any MDM implementation, there is a customization that’s needed within that framework. So the platforms really need to be flexible to map to those specific business processes or business rules that that company needs. I think that within the market, there is some confusion about should I have a master hub or should I have the federated type, what you call a registry style, etc. Vendors who provide databases and a data platform, of course, believe you need to actually have that data in a place centrally located, etc...
Analytical Sandboxes - A little bit about analytical sandboxes, this topic got kicked off two years ago at a conferences geared to BI directors and BI sponsors. People talked about how they had hundreds and hundreds of these spreadmarts. They called them desktop databases. They were clearly much bigger than just a simple spreadmart. Someone estimated that each one was costing the company $500,000 or more. To get ahead of this, what they decided to do was to give each analyst his or her own partition in their enterprise data warehouse. And allow them to upload their own data into that partition and mash it up with warehouse data...
Analytics and Data for e-Commerce - In the early days of eCommerce, the first retailers had to overcome a great challenge of convincing customers to trust them. Giving out credit card numbers and personal details online was something that many didn't really trust, so Amazon and other retailers had to do a great job to get the public put their faith into this new way to pay and shop. As customers have gotten super comfortable with shopping online, the eCommerce industry proliferated, with global retail sales reaching $3.53 trillion. Today, online retailers have to face yet another profound problem: the diversity of customer choice. While this may not sound like an issue at all, giving too much choice and too little assistance and guidance can: easily confuse customers and make them leave the site convince them to put off the purchase look for a product on a competitor's site visit a brick and mortar store instead...
Analytics Have Moved Beyond The Data Warehouse - Okay, move onto the next topic here. I think we have moved to a point where analytics have moved beyond the data warehouse. A data warehouse is obviously a good repository for certain types of functions within the organization. When we start talking about sound data of when we're talking customers calling in and the recordings of those customers and for trying to do sentiment analysis on those or categorizing calls or trying to analyze certain calls from the wider body of calls to find out what worked, what didn't work. If we talk about transactional data, and we're not just talking about storing transactions for operational purpose, we're really trying to detect anomalies in those transactions, so we can â€" if there's something really wrong happening here -that we can interfere with those. Sometimes it takes a little bit more than just the simple business rule to determine whether an individual transaction is fraudulent, for example, or is going against policies or whatever. We talk about sensor data and the whole Internet of things, and this is another really big hype another one. We could talk about for an hour on this. What data should those sensors be collecting? We talk about oil rig maintenance and trying to determine when is the right time to schedule a maintenance appointment for those oil rigs. Shutting down those rigs is big money and doing it at the right time so that it's not inefficient or costly is key. Doing it too early means you're actually wasting money, and I hate using that as an example because I would much rather that we could find another way to get around than using oil...
Analytics Solution for data.gov - Looking for a good analytics solution that is compatible with data.gov? InetSoft's pioneering BI application produces great-looking cloud-based analytic views with an easy-to-use drag-and-drop designer. View a demo and try interactive examples...

Analytics Technologies Being Employed - Now let’s talk a bit about the analytics technologies being employed. How is analytics infused within an enterprise business process? What business value or ROI can be gotten by good analytics? It’s a question that on the surface is pretty straightforward, but I think it's a good question. We would encourage that question to be peeled back several layers by our clients. I think if they do, what they are going to find, I think that the true return on investment within a business intelligence platform may or may not be the initial price tag, right? It’s a total cost of ownership play. The questions are what is our ability to get a solution to market, to support that solution overtime, and to deliver incremental improvement as well as step change innovation over a three to five year period. And I think from our perspective, we recognize that that our a very unique BI platform, that you have an ability to start with a very cost effective core but then layer incremental value on it overtime, and that’s the way we have tried to go to the market. We will continue to challenge ourselves to go to market with solutions that have a very short return on investment per today’s measurements...
Analytical Tools Example - Is your company's data too big and complex to understand? InetSoft is your solution! With InetSoft's analytical tools, you can expect fresh new insights that will increase both the internal and external performance of your organization...
Analytics Tool for SurveyMonkey - Looking for a better reporting tool for SurveyMonkey? InetSoft's pioneering dashboard reporting application offers greater self-service and personalized reporting, advanced chart types, and the ability to create data mashups with other organizational data. View a demo and try interactive examples...
Analyze Management Performance - Here is the thing you learn when you analyze management performance. You have got the top-level echelon there, and they are sitting in a little glasshouse, and they think everything is great, right, that’s a typical classical scenario. And then you have the staff down there at the very bottom, and you know, they are hands-on everyday with that equipment and whatever, and they know the stuff is just falling apart. It’s a complete disconnect. This is a tool to identify the disconnects. The scores can be separated by the different stakeholders. And areas where you have large disconnects, where there are completely different beliefs among the different stakeholders, guess what, you cannot implement any change in that area unless you first get all of these groups to agree that there is a real need to work in that area. That means they all believe the same things, and they all believe that they are equally good or equally bad at that. You can’t move forward because even if the top executives believe there is a change needed, hey, they are going to run into resistance if the bottom of that organization does not believe there is a need for that. So it’s going to be one of those mandates that never gets executed. So, it’s another tool that we look at...
Analyzing and Exploring Data - Now, what they’ve discovered is when you get beyond a certain point of response time, of interaction time, where you say or do something, and then there’s an expected response that you have to wait for, it breaks your brain. Basically the model of your brain building up a memory buffer of what you’re thinking about, your next thought, your next input, your next task, gets derailed if you have to wait too long, and you have to start over. And so, what you would expect to see is response time and how you thought are directly correlated. You do something, and something happens. It is a straight line graph. And now in general this wait time needs to be less than three seconds, and it’s a cross-cultural thing. And what happens when you don’t have that ability to interact in real time, you have a disruption of your work. And when you have that disruption of work, you have this interrupted flow of work which means an interrupted flow of thought, which makes it very difficult do analysis. When you’re trying to analyze things then you can’t get into what’s called flow. And these different places you can end up with are charted out on this graph which based on the skill level and the challenge level. At least initially, you can end up in these different points where the skill and the challenge are matched. That’s the first precursor to be able to get into a state of flow which you can think of as that mental state where you’re in the zone, where you’re in an optimal state of what’s called intrinsic motivation. You’re immersed, and you can work. And the tools or the things that you’re using or working with come naturally exactly when you need them. You lose track of time. Things work...

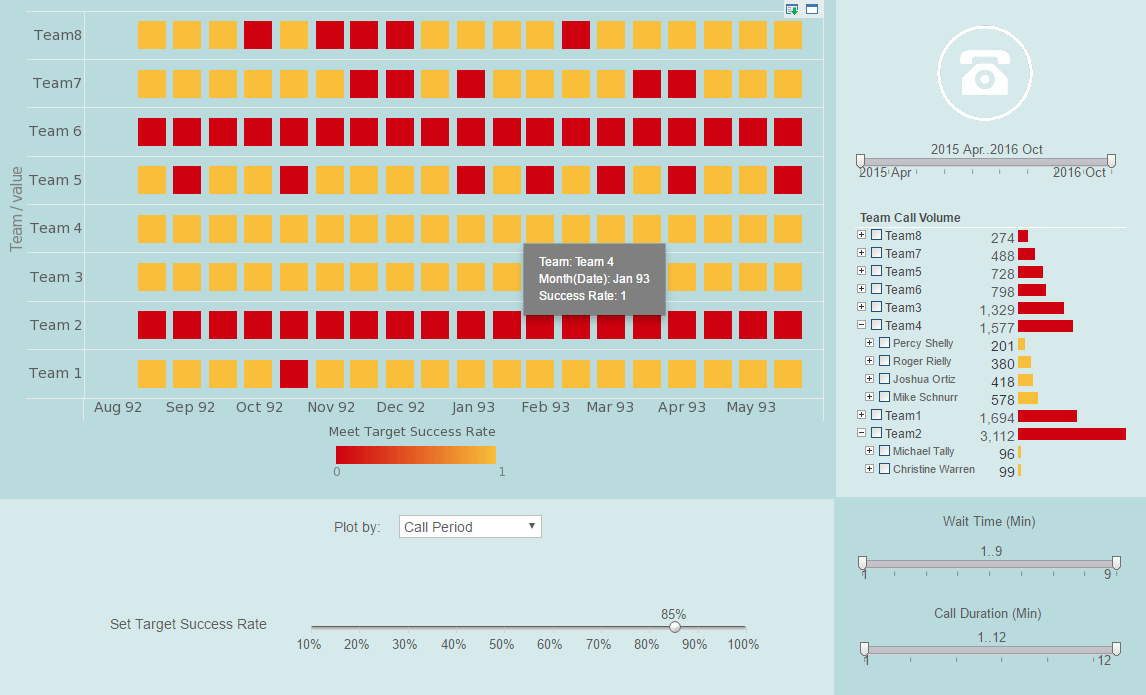
Analyzing Call Rep Performance - Let’s analyze the performances of the call reps, I have a variety of results. This is looking at the percent pledges to all the calls by callers. This side is good. These people are getting 5% and up response rates. These people are getting no response rate, and this is the common group of prospects I’m going after. Let’s look at the bottom end of this. There is a goal here, at least one percent. If I click on the goal line, I’ve now selected the callers and the calls for the under one percent response rate. This is the problem. I may not want to also include zero response rates. These people weren’t getting pledges, but some of them were also getting a lot of refusals. In fact, this group above the red line is getting 5% of their attempts to this top group of donors as refusals. Let’s click that, and I’ve got the people who have done under one percent on the pledges and over 5% on the refusals. Who are they? From the student data I can tell more about these callers. This heat map shows the number of calls made and the caller’s percent pledges. Red is worse. Green is better. I can quickly see that I’ve got some problems with my sophomore grade. The bright red shows them. I’ve got some problems, and some of these majors where those people are doing less well and some of the other majors are doing better. History is more green or lighter color. Hispanic studies, these people do better, these people worse...
Analyzing Customer Survey Data Is a Good Example - Now let's focus a little bit on the why questions which are contained in unstructured information. Analyzing customer survey data is a good example. Almost every enterprise has run surveys of customers from time to time, and often times what happens is you have the very structured responses to survey questions where there are different options that users can choose from, but you also have that other box or additional comments box. In most enterprises you store that information away, but if you haven’t asked the right questions in your survey you may not be able to determine, hey our customer’s unhappy without access to that data. You won’t be able to unlock what's happening in the unstructured comments. You are not going to understand why. So there are a whole variety of sources of unstructured information that are really critical to understand that why insight. For emails and documents, blogs, products review sites, your CRM call transcripts, all that type of information can be used through a Unified Information Access platform to make better and faster decisions. So those are a couple of examples. For other examples of the use of unstructured information within the enterprise, one is looking at IT incidents, being able to tap into knowledge bases and historical issues to provide key context...

Analyzing Streaming Data - This ties into what we talked about in terms of deploying these models in production in real time. The earlier points we've made about automation which I think apply in a typical organization even actually the leading edge Bay Area start up internet companies, but there's this distinction between software engineers and data scientists. What is this distinction? Software engineers tend to be very good at writing code. They're very disciplined. Their code is very nice. It scales. It's easy to maintain. Data scientists are very good at the analysis of data and making sense of data. Usually when a data scientist does an analysis and builds a model they end up having to hand over their model to a software engineer who then rewrites it into the production environment, according to the standards of the production environment. On the other hand to the extent that a software engineer can do what a data scientist can do, because obviously there are these easy to use machine learning libraries that they can use for themselves. It's possible that they do some of that, but I think if you talk to many people who work with data they will tell you that â€" for many software engineers their strength is really in actually writing something that's been well specified and spec'ed out. With data scientists, their strength is in the data discovery and learning what the right model to use. Whenever there's a little bit of ambiguity around the project then it becomes harder for a software engineer to actually do something that replicates what a data scientist can bring to the table...