Product Analytics: KPIs and Advanced Techniques, Leading Solutions
Product analytics involves tracking and analyzing user interactions with digital products to inform iterative improvements. For experienced practitioners, it's a core discipline that leverages event-based data to refine features, boost engagement, and align with business objectives.
Tools like Mixpanel or Amplitude enable granular event tracking—such as sign-ups, purchases, or drop-offs—allowing segmentation and visualization for deeper insights. Key questions addressed include user drop-off causes, feature impact on engagement, and retention strategies.
This practice minimizes reliance on intuition by providing empirical evidence for product decisions. For example, a SaaS team might analyze onboarding flows to reduce friction and increase adoption. Without robust analytics, products can stagnate amid competition. Moving forward, we'll cover essential KPIs, their definitions, and interpretations, followed by advanced techniques.


Core KPIs in Product Analytics
KPIs quantify product performance against goals, categorized into engagement, retention, monetization, and acquisition. They interconnect, and industry benchmarks vary, e.g., social apps prioritize DAU, while enterprise tools focus on churn. Dashboards in analytics platforms facilitate monitoring.
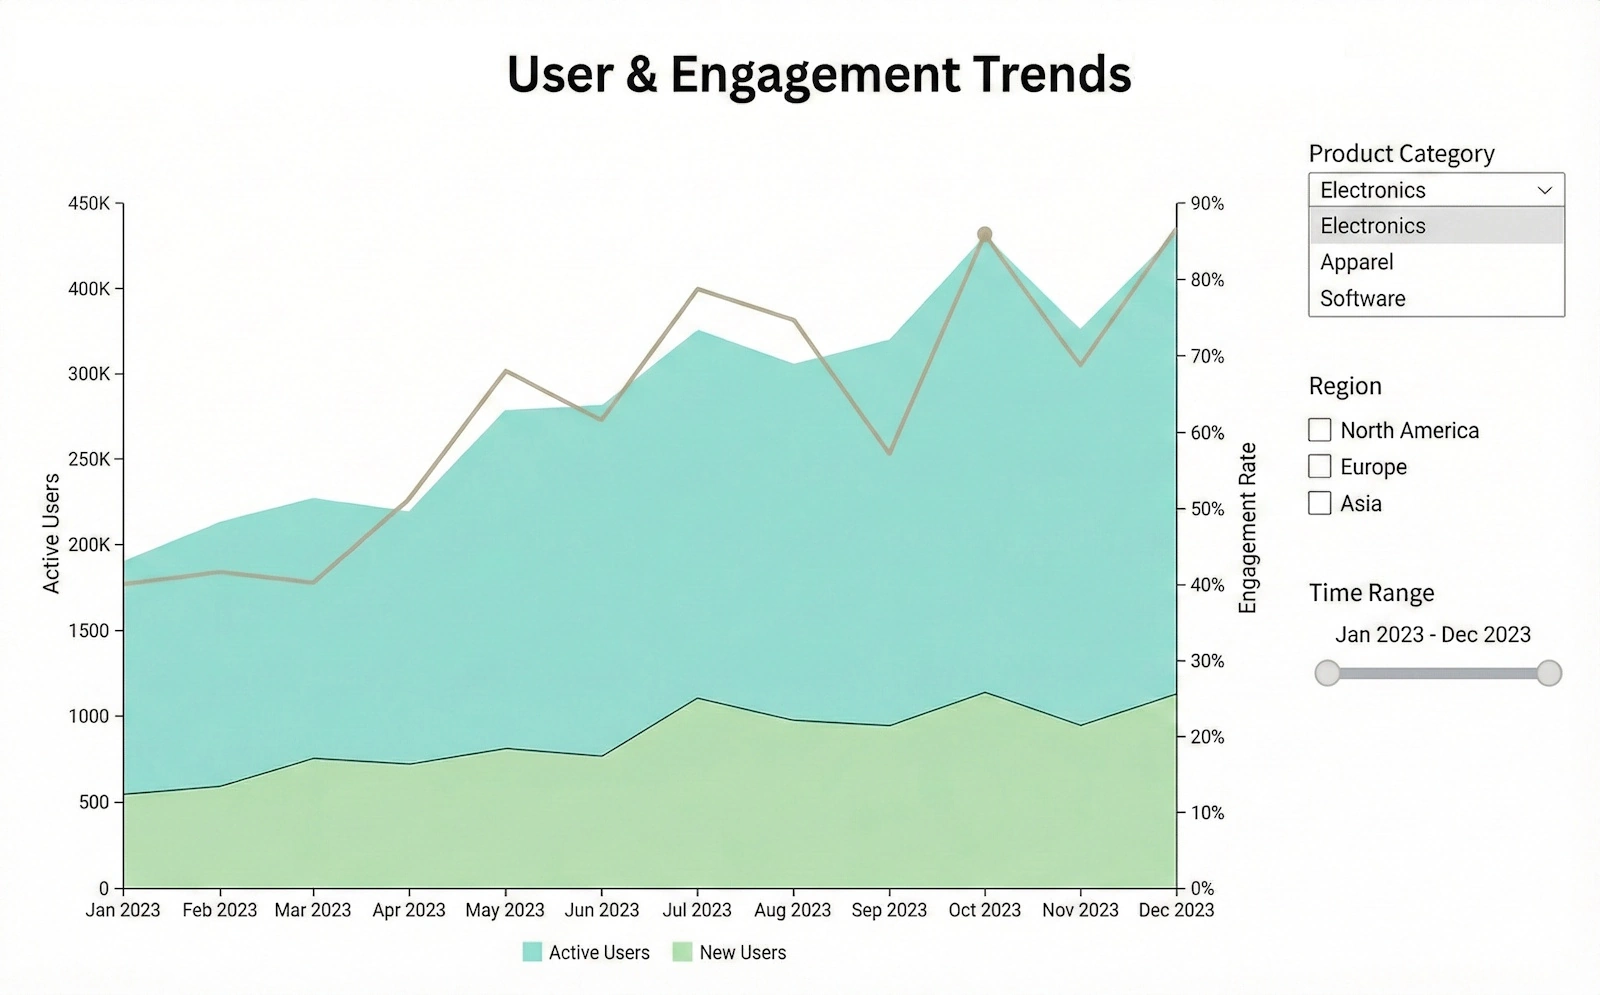
Daily Active Users (DAU) and Monthly Active Users (MAU)
DAU counts unique daily interactions; MAU does so monthly. The DAU/MAU ratio measures stickiness—e.g., 20-30%+ for consumer apps indicates daily habits. Low ratios may highlight engagement issues or seasonality, like post-holiday dips in e-commerce. Track cohorts to assess feature impacts; compare against peers for context.
Retention Rate
Percentage of users returning post-initial use, calculated as (end-period users - new users) / start-period users * 100, often at D1, D7, D30, or D90. Strong rates (e.g., 40%+ at D30 for e-commerce) signal sustained value. Declines point to UX flaws or mismatched expectations. Cohort analysis reveals update effects; high retention lowers acquisition dependency.
Churn Rate
Complements retention as lost users / start-period users * 100. Subscription models aim for <5% monthly. Elevations suggest support gaps or feature deficiencies. Pair with CAC for ROI; mitigate via re-engagement tactics like targeted notifications.
Conversion Rate
Completions of key actions / total visitors * 100, such as purchases in funnels. Typical 2-5% for e-commerce. Identifies journey friction—e.g., complex checkouts. Optimize through A/B tests; uplifts directly enhance revenue.
Average Session Duration and Sessions per User
Duration averages time per session; sessions per user tally repeats. Content platforms seek 10+ minutes for depth. Short metrics imply irrelevance. Combine with bounce rates for engagement diagnostics.
Net Promoter Score (NPS)
Survey-based, (% promoters - % detractors) from 0-10 likelihood-to-recommend. 50+ scores denote loyalty. Correlates with growth; segment responses to pinpoint improvements.
Customer Lifetime Value (CLV)
Projected revenue per user: average value * frequency * lifespan. Gaming apps leverage in-app purchases for high CLV. Ensure >3x CAC; adjust monetization if low.
These metrics form a framework—e.g., retention boosts CLV. Use SQL or platform queries for custom views.
Advanced Techniques in Product Analytics
Beyond KPIs, advanced methods employ statistics, ML, and modeling for predictions and personalization. Integrate with SQL, Python (Pandas, Scikit-learn), or tools like Amplitude.
Cohort Analysis
Segments users by attributes (e.g., acquisition date) for longitudinal tracking. Reveals patterns like campaign cohort churn from value mismatches. Visualize via heatmaps to prioritize loyal groups.
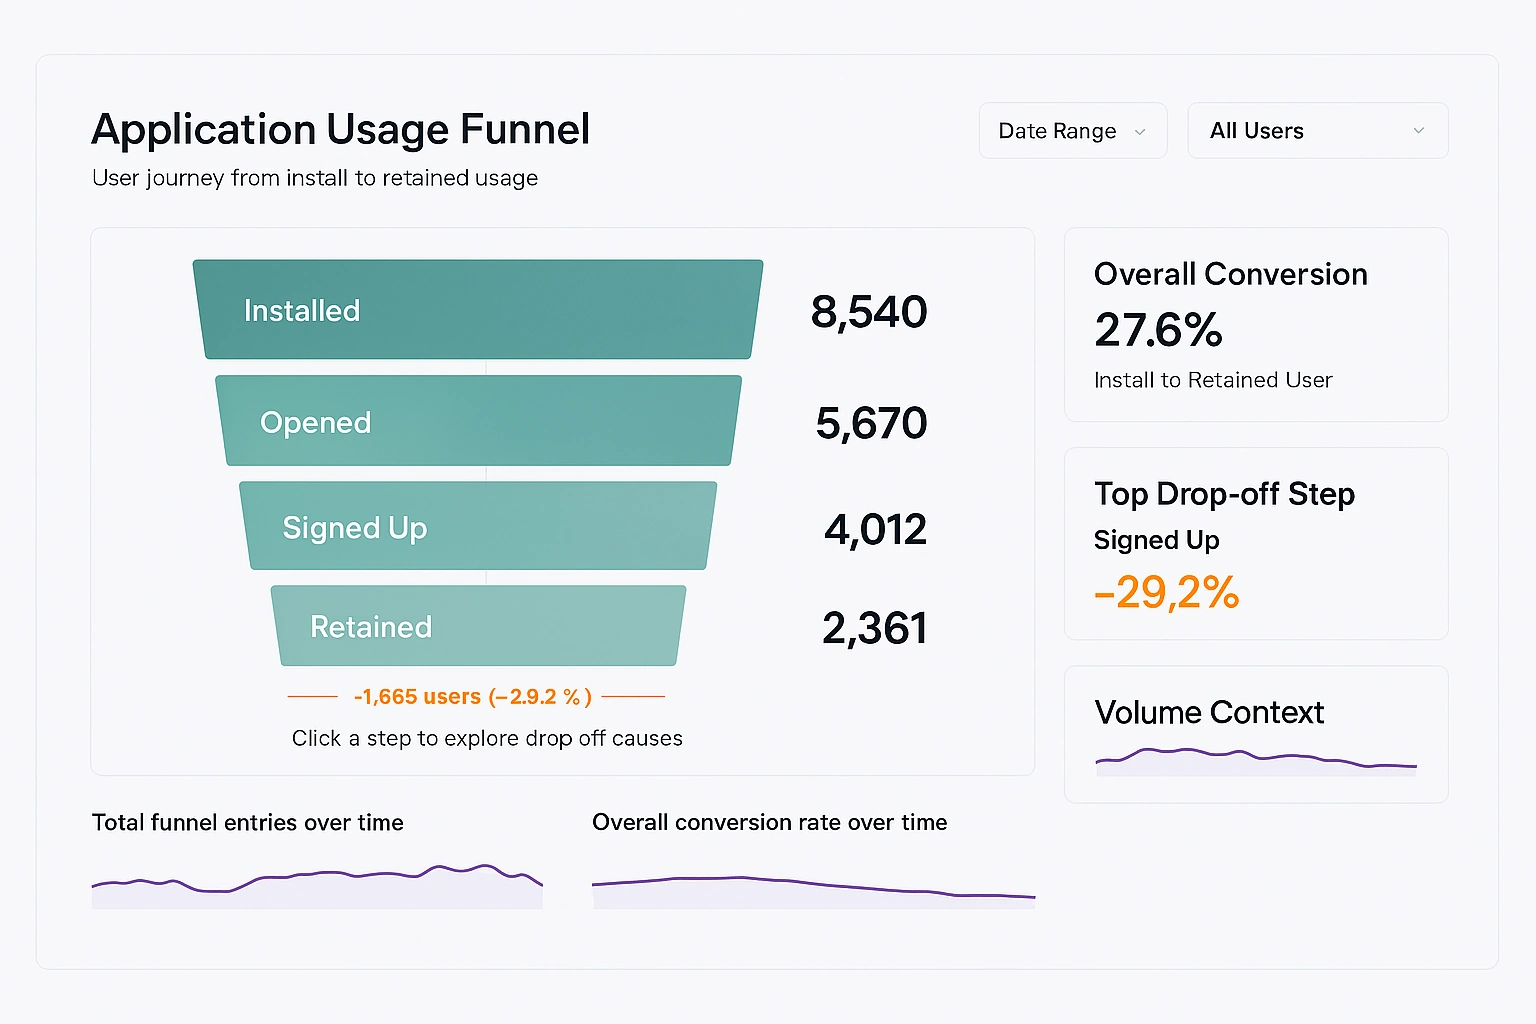
Funnel Analysis
Maps conversion steps, highlighting drop-offs. ML-enhanced versions predict issues. E.g., 70% payment abandonment might trace to load times; automate with tools.
A/B and Multivariate Testing
Compares variants for KPI lifts, using significance tests (p-values). Segment results; ML automates hypotheses.
Predictive Analytics
Models forecast behaviors, e.g., churn via logistic regression on features like frequency. Advanced: Neural nets for CLV or recommendations, as in Spotify's playlists.
User Segmentation and Personalization
Clustering (K-means) groups behaviors for targeted strategies. E.g., "casual" vs. "power" users in news apps; engines deliver customized experiences.
Path Analysis
Sequences actions to map journeys, using graphs for anomalies. Session replays (FullStory) aid optimization.
ML Integration
Anomaly detection flags KPI shifts; NLP analyzes feedback sentiment. Reinforcement learning refines pricing.
Implementation demands clean ETL pipelines and collaboration.
StyleBI as an Alternative for Clean Data Pipelines
StyleBI, an open-source business intelligence platform developed by InetSoft, serves as a compelling alternative to specialized product analytics tools like Amplitude and Mixpanel, particularly for organizations seeking integrated data handling capabilities. While Amplitude and Mixpanel excel in event-based tracking and user behavior analysis, StyleBI stands out with its unified approach that combines a robust data transformation pipeline with visualization microservices.
This makes it ideal for teams that need to mash up diverse data sources—such as user events, databases, and external APIs—into cohesive datasets without relying on multiple disparate tools. Its cloud-native, small-footprint design allows for flexible deployment, whether as standalone Docker containers or embedded in existing applications, reducing overhead and enabling seamless integration into product workflows. For product teams, this means shifting from siloed analytics to a more holistic BI environment where data preparation and visualization occur in one web app, accelerating insights and reducing dependency on complex ETL processes.
Especially for creating clean data pipelines, StyleBI's powerful data mashup engine simplifies the ETL (Extract, Transform, Load) workflow, ensuring data quality and consistency from ingestion to analysis. Users can design pipelines with a gentle learning curve, leveraging machine-assisted tools to handle data cleansing, normalization, and aggregation efficiently. This contrasts with Amplitude and Mixpanel, where data pipelines often require additional integrations or custom scripting for advanced transformations.
StyleBI supports rapid prototyping of dashboards and reports directly from transformed data, minimizing errors and promoting reusability through modular microservices. For instance, in a product analytics scenario, teams can ingest raw event data, apply transformations to filter noise or join with user metadata, and output clean datasets ready for cohort analysis or predictive modeling—all within a single platform. This not only streamlines operations but also enhances governance, making it a cost-effective choice for growing companies aiming for scalable, maintainable data infrastructures.
Amplitude vs Mixpanel Comparison
Category
Amplitude
Deep product insights, advanced cohort analysis, predictive analytics, and enterprise governance. Ideal for tracking individual active users and multi-product environments.
Mixpanel
Real-time event tracking, funnel analysis, and granular user behavior. Best for B2B companies with high event volumes and quick setup for cross-functional teams.
Pricing
Amplitude
- Free Starter plan: Basic analytics, limited to ~10M events/year.
- Growth/Plus: Starts around $995/month with A/B testing and CDP.
- Enterprise: Custom pricing for high volumes and governance.
Premium pricing but strong scalability.
Mixpanel
- Free plan: Up to 20M events/month.
- Growth: Starts at $25/month with advanced reporting.
- Enterprise: Custom pricing.
More affordable for scaling companies; sampling helps manage volume.
Key Features
Amplitude
- Behavioral cohorts and segmentation
- Native CDP for personalization
- A/B testing and experiments
- Predictive modeling and AI
- Strong data governance and autocapture
- Multi-platform tracking
Mixpanel
- Real-time dashboards and signals
- Flexible event-based analytics
- Funnel and retention analysis
- User flows and path analysis
- Developer-friendly API
- Customizable reports
Ease of Use
Amplitude
More structured interface; steeper learning curve for non-analysts but strong visualizations. Requires more setup for advanced features.
Mixpanel
Faster setup and more accessible for cross-functional teams with flexible charting.
Integrations
Amplitude
Extensive integrations with marketing tools, warehouses (Snowflake, BigQuery), and CDPs. Strong enterprise ecosystem support.
Mixpanel
Solid integrations with CRMs, email tools, and data platforms. Developer-friendly for custom setups.
Scalability & Performance
Amplitude
Handles large datasets with real-time updates; strong governance. May slow with extremely large segments.
Mixpanel
Excellent for high-event volumes via sampling; real-time performance is a strength.
User Ratings (Aggregated)
Amplitude
Average ~4.5–4.6 across platforms.
Mixpanel
Average ~4.4–5.0 across platforms.
Best For
Amplitude
Product teams in B2C or enterprise needing predictive insights and governance. Ideal for long-term strategy and personalization.
Mixpanel
Growing companies, B2B teams, and those prioritizing real-time analytics and ease of implementation.
Pros & Cons
Amplitude Pros
- Granular segmentation
- Strong collaboration tools
- Enterprise-grade security
- Generous free tier
Amplitude Cons
- Higher cost for advanced plans
- Complexity with large datasets
- Steep learning curve
Mixpanel Pros
- Flexible data exports
- Real-time insights
- Affordable scaling
- Custom segments
Mixpanel Cons
- Limited segmentation vs competitors
- Basic AI features
- Event implementation curve
More Articles About Analytics
Business Analysis Solutions - Are you looking for a way to increase profitability? Maybe you're searching for the ideal way of doing business. Perhaps you just want to know why your business is doing well, or how you can maintain that status. Fortunately, you can find the answer to all of the above inquiries through business analysis. Business analysis is the process by which you identify what your business needs and determine how you can best meet that need...
Business Analytics Software - Today we are going to talk about business analytics. I want to start by referring to a man named Thomas Davenport who has written a book, Competing on Analytics, which is based on a study of companies using analytics. Among the findings he reports in the book, he discovered that the top performing organizations are 50% more likely to utilize information strategically or analytical information strategically. There are a couple of levels of strategic analysis that he is referring to. One level is where there is significant analytical support within an organization. This means that they are a data driven organization. They make decisions based off of the actual information available as opposed to gut feel which is often the case when people don’t have adequate access to information. The next level is where they value analysis across the organization from a sponsorship or from an executive level. They also have higher than average analytical support capabilities. And finally the last level is when they have analytics across the organization. This means not just for the privileged executives or the technically capable analysts but for all users including the business users, the casual users, people who don’t necessarily spend a lot of time in business information systems. The key message here is that analytical information can help drive strategic performance and competitive performance in the organization...
Business Analytics Toolset - Are you looking for a business analytics toolset for 2022? InetSoft's pioneering analytic application produces great-looking web-based visualizations with an easy-to-use drag-and-drop designer. Get cloud-flexibility for your deployment. Minimize costs with a small-footprint solution. Maximize self-service for all types of users. No dedicated BI developer required. View a demo and try interactive examples...
Business Intelligence Analytics - InetSoft's business intelligence analytics solution features a powerful computational engine that is capable of integrating data from various sources simultaneously and providing real-time human-centric results and analysis through visualization driven charts, dashboards, and reports...
Business Intelligence and Analytics - InetSoft's Style Intelligence provides the reporting and analysis basis needed to guide your daily actions and tweak your strategy for the better. With this high performance dashboard software, you can gain real-value insights that are both meaningful and actionable. InetSoft's StyleBI is an easy-to-use, interactive dashboard software that includes real-time reporting capabilities. It gives the user the ability to collaborate the afforementioned data block technology with BI visualization..
Business Intelligence vs. Business Analytics - What is the difference between business intelligence and business analytics? Since the two words are often incorrectly used interchangeably, the distinction can be confusing...
Case Study About Using Analytics to Perform Better - The next case study about using analytics to perform better is about a racing team. I’d like to ask all of you what does winning the race mean to you. This racing team is literally using data to win races. They are taking in over 30,000 bits of information per second during a formula one race. They have the guys in the pit looking at the information and can know exactly when a driver needs to stop at the pit to change the tire up to the sub second, and they can do all preventative maintenance at that moment. The driver receives real time information to better perform and win the race and knows exactly what their competitors are doing. He knows exactly when they’re breaking, exactly when they’re pushing the gas and what he needs to do to win that race. What is most interesting about this is not the fact that they’re using data to win the race, not the fact that they’re doing preventative maintenance, but the fact that they are then using this information to improve the quality of the car’s features, so they can minimize pit time and improve the driver’s performance in the future. So this is taking data and becoming a Big Data company. They could -- they are literally, this is their differentiation to win that race. And the last point that I like to hone in on although I have so many I want to share and that are so profound I love to share something like this and I had so many around this but how do you actually change the world and change healthcare you know in the future...
Case Study: Building Real Estate Analytics - Are you looking to build a scalable and adaptable analytics system for tracking realtor performance across various US markets. The goal is to display aggregated performance metrics, such as sales volume from both listing and buying perspectives, filtered by levels like state, county, zip code, or MLS, with customizable date ranges. These metrics should also roll up to the office level to identify top-performing agents within offices. You need to combine three datasets—listings, tax/assessor records, and office information—into a single large fact table in Snowflake. This table aggregates agent performance by year and month across those geographic areas, enabling queries like comparing agents in a specific zip code, identifying an agent's top sales regions, or calculating average listing prices...
Case Study of Event Marketing Analytics - Let me give you an example of event marketing analytics. When you’re planning big conferences you want to understand how many people are registered from what industry and what type of programs. Do you have content to meet all of their needs? So you have a data scientist or a data analyst bring together this information with a BI tool. It’s a massive amount of data from many sources, and you bring it together, data from registrations, from Twitter about what’s the sentiment of the event, historical information on past events to understand what was successful in the past. You mash it together. The questions that your CMO asks are very different than the questions of the event planner who was setting up the event. The operations people also use that data, but they ask very different questions, and they manipulate that data in very different visualizations. And that’s what I’m talking about. That needs to happen in the future, because the reality is not only do people get involved in data more than they ever have before, but also people’s needs in terms of what they do with data has changed...
Casino Managers Use Analytics to Improve - Analytics is an invaluable tool to ensure a company's development and growth. The metrics they produce are the driving force behind successful advertising campaign strategies. They can often be the savior in discovering why things are going wrong. Nowadays, almost every business will use analytical tools to aid their business model, from social media platforms such as Facebook to consulting firms like Scanteam. No matter what the industry, extracting data intelligence has a myriad of benefits. Analytic data in the casino industry has many uses. According to Alex Lysak, it has been used for decades in brick and mortar establishments to improve and expand. Thanks to the advancement in analytic technology, casino science is now revolutionizing online operations. Below, we'll explore how casino managers use analytics to improve their businesses...
Central BI and Analytics Team - The central BI and analytics team has a lot of visibility into the different data sets people are using and how they are building their worksheets or dashboards because they are able to see what's popular, what's not, what maybe is coming from sanctioned sources versus we call more unsanctioned sources. They can keep a good eye on things. So it's enabling people to continue to explore their data in an unfettered manner, but also helps people to be able to get really good visibility into what data is being used to make decisions and standardizing data definitions and those things. And yeah that was the use case I wanted to highlight. We've have some other really fantastic partners playing in the space because it's one that's very hot right now. Holly: Well, it does speak to helping with self-service and both the agility of the pipeline that the metadata and helping people learn what's available and how to get at it. It speaks to increasing the agility of the pipeline. It really helps with that, and it's the same with the balance between the governance and self-service...

Choose InetSoft Over Explo for Embedded Analytics - When you are choosing an embedded analytics platform, you are not just picking charts and dashboards. You are choosing a long-term architecture for how your product will handle data modeling, security, customization, and scale. InetSoft’s StyleBI platform is designed as a full-featured, cloud-native business intelligence and embedded analytics solution, while Explo is a focused, streamlined tool for quickly standing up customer-facing dashboards. Both have strengths, but if you care about depth of data capabilities, deployment flexibility, and long-term control, InetSoft offers a broader and more future-proof foundation. InetSoft is a complete business intelligence web application that includes data preparation, transformation, and visualization in a single platform. It is built to support both internal analytics and embedded use cases, so you get a unified stack for ad hoc analysis, governed reporting, and customer-facing dashboards. Explo, by contrast, is intentionally narrow: it focuses on quickly embedding dashboards into SaaS products with a strong emphasis on front-end simplicity and white-labeling. That focus is attractive for very simple use cases, but it can become limiting when you need richer data modeling, complex joins, or enterprise-grade governance...
Choose InetSoft Over Plotly - Choosing the right business intelligence (BI) and analytics platform is crucial for organizations looking to leverage data effectively. While there are numerous options available, InetSoft and Plotly are often compared due to their capabilities in visualization and analytics. Despite Plotly’s popularity for interactive visualizations, InetSoft offers a more comprehensive, enterprise-ready solution that addresses the broader needs of modern organizations. Here’s an in-depth exploration of why InetSoft stands out over Plotly. InetSoft provides a full-featured BI platform, covering everything from data integration and preparation to analytics and reporting. Unlike Plotly, which is primarily focused on creating interactive visualizations and charts, InetSoft delivers online end-to-end solutions. It allows users to connect to multiple data sources, blend and transform data, and build dashboards and reports that can be scheduled and shared across the organization. This holistic approach reduces the need for multiple tools and simplifies workflows, which is especially valuable for enterprises managing complex data ecosystems...
Comparing InetSoft's StyleBI to Qlik Sense - Selecting Business Intelligence (BI) solutions for an organization is hard, risky, and inherently biased. But the process is made easier by the G2 Crowd review platform with its real-time, transparent and unbiased user reviews. This helps an organization to objectively assess what is best by leveraging the wisdom of the crowd, limiting the risk, and finding out what works. The reviews are validated by G2 Crowd thereby helping organizations make better buying decisions...
Compress the Time Between Analytics Question and Answer - Right, well suffice to say it certainly sounds like you've been able to compress the time between analytics question and answer. This isn't a long term batch issue, and that allows investigation to take place where one answer to a question leads to the next question, and you can't get there rapidly without that process. So tell me a little bit about speed, not just speed of data but speed of investigation. How is your data science solution supporting that? Jim: So one of the most difficult things to do it in investigation is if you imagine a dataset of a billion services, and that's a pretty good number of services. What I mean by service is when you go to the doctor, and they do a procedure, that's typically called a service, and when you have giant dataset of a billion or more of these services your job is to go figure out today which ten are bad. That's a classic needle on a haystack. So what we've done is provided a risk management framework over the top of that where we have advance sensors in our data science platform that go and look for all these combinations of bad behaviors up in mass, and the analytics will run these things very, very fast, and they supply up all of the services which are highly questionable...
Concept of the Analytical Enterprise - We've spoken a little about the whole concept of the analytical enterprise. This slide tries to reflect that. Analytics in the insurance organization is interconnected. Of course, we can start anywhere on this wheel, but let's start just for the sake of a particular point in the area of risk appetite. The topic of risk tends to underpin the strategy of an insurance company. Risk starts driving issues like underwriting and pricing, and of course, then that's not influencing the whole topic of marketing and distribution because if the insurance company identifies what they want to underwrite and want the price competitively, then that informs the marketing and go to market strategy generally. Once you've identified what they are selling and who they are selling to, there is a whole issue of the servicing topic including claims management. Claims we recognize as being the moment of truth in the insurance value chain. The claim service invaluably involves the use of the supply chain system. Claim settlement is based on supply chain management, and analytics can be a key tool in terms of how we actually deliver that. If supply chain management is poorly done, then that gives rise to operational risk which takes you all the way round again in terms of risk appetite and solvency. It's a complex and interactive model...
Consumerization of BI for More Intuitive Data Analysis - Sure. Well, so I think that that is fundamental to this whole question, right? I mean everybody wants the device that they use or the apps that they use to be intuitive. But the problem is that there isn’t really native intuition when it comes to software; there is just familiarity. And this software behaves similar to what I have been exposed to in the past, and that sort of replaces innate intuition. And so I think that brings the difference between training and education to the forefront. With training, I know what I want to do, I just have to figure out how I do it with this tool. Education is really teaching people what the right things are to do...

Creating A Hierarchical Olap Overlay - Creating an OLAP overlay is straightforward. The Hierarchy tab of the logical model provides an interface to create the overlay. Entities and attributes are listed in the left pane in a tree structure. To add a dimension to the overlay, simply drag an individual attribute from the ‘Entities’ panel to the ‘Dimensions’ panel. You can also drag an entire entity to the ‘Dimensions’ panel, in which case all attributes of that entity are added as a dimensional hierarchy. The order of dimensions inside each dimensional hierarchy is significant, as this is the order of the drilling hierarchy. When creating dimensions, the Date dimension should be given special attention, since breaking a single date field into individual components can drastically increase usability for the end user. Additionally, mapping date components into business attributes can be a powerful usability enhancement, for example, mapping the month of a date field so that June becomes “calendar month 1,” and so on. To create new date components of this kind, you can define expression attributes in the Model tab. These expression attributes will then be available for use in the hierarchical overlay. For example, to create a new ‘Month’ attribute in which June is “calendar month 1,” you could define a new expression attribute with the formula...
Custom Analytics for Zapier - Looking for a good solution for Zapier dashboard reporting? InetSoft's pioneering BI application produces great-looking cloud-based dashboards with an easy-to-use drag-and-drop designer. View a demo and try interactive examples...
Customer Analytics Software -InetSoft's unique interface consists of reporting options which are flexible and adjustable to the needs of the user. With the user in mind, the software was designed to be easily deployable and to require minimal training. StyleBI provides businesses with a software solution that securely collects data from various data sources and efficiently compiles the information to produce high performance dashboards. These dashboards contain interactive graphs, complex charts, and detailed reports that are easy-to-read and ready for analysis...
CX Analytics Solution for Omnichannel - Let's go ahead and dive in to our first topic. In the age of digital omnichannel CX, Abhi, what metrics do you think matter the most? Abhi: I think some of the mainstays that I would think drive the customer experience, obviously, the top and foremost is customer satisfaction. They'll tell you immediately if their experience has been great, or if it could be improved, and they're not shy about letting us know that. I think some of the other things that we look at is NPS, or net promoter score.What's important there is making sure we're delivering on any SLAs, service level agreements, so that we're meeting customer expectations in the time that they would expect us to respond. Then with escalations, how often customers have to escalate issues for more visibility or urgent issues that are important to them. Interviewer: In terms of the metrics clients typically rely on, what's your take? Navish: I do see a lot of those as well, NPS, CSAT, or customer satisfaction. Then I see a lot of focus as people move upstream, because those CX metrics are outputs. They analyze the KPIs that will add value and eliminate the concerns around that. Moving towards resolution metrics that I think we'll talk about as well, whether it's issue resolution or first call resolution...

Dashboard Analytics Provider - Are you looking for a good dashboard analytics provider? Since 1996 InetSoft has been making BI software that is easy to deploy and easy to use. Build self-service oriented dashboards and visual analyses quickly. InetSoft's data mashup engine solves the data access and transformation challenges that other tools cannot. View a 2-minute demo and read customer reviews...
Dashboards and Analytics for Google Search Console - InetSoft's business intelligence dashboarding software connects to Google Search Console for better KPI dashboarding and a greater ability to drill and filter. Advanced data visualization methods such as heatmaps and bubble charts allow for visual analysis of more than two dimensions at once such as appearance volume, ranking, and CTR. Finding significant keyword performance changes over time is also easier. Google has made available a vast amount of detail by query, no longer just rolled up into aggregates. With access to what is essentially a Big Data source, you need a more flexible but easy-to-use data analytics tool such as InetSoft's. While Google's built in charts and filters are quite helpful, they are limited to two-dimensional line charts and data tables which you need to export to do further analysis on. With a live connection to GSC data, InetSoft's tool allows more efficient repeatable analysis and weekly dashboarding...
Data Analysis Program - Are you looking for a data analysis program to help you visualize and analyze data, answer business queries, and increase overall project efficiency? Since 1996 InetSoft has been making BI software that is easy to setup and easy to use, allowing users to build self-service oriented dashboards and visual analyses quickly.

Data Analysis Reporting - Official reports complete with data analysis are vital for a business to identify their strengths and weaknesses. Data reporting is the process of collecting data and manipulating it to make it clearer for the audience that is analyzing it. For instance, if a business that baked cookies was trying to show an investor the data involving their sales and which months their sales were the highest, they would have a difficult time just showing them the raw data and trying to explain the correlation between the two...
Data Analysis Software Download - Are you looking download a data analysis application? Since 1996 InetSoft has been making BI software that is easy to set up and easy to use. Build self-service oriented dashboards and visual analyses quickly. View a 2-minute demo and download a free version...
Data Analytics Lessons from How Real Estate Agencies Operate - During the past few years, technologies like big data, data analytics, automation, and machine learning have been a hot topic across industries. In the real estate industry, in particular, data analytics has a lot of potential for streamlining processes, reducing costs, and increasing profits. However, the huge volume of data that real estate transactions require and generate daily can pose problems. These include difficulties in determining which data points are actually useful and how these can be utilized effectively. Below, we discuss some of the ways data analytics and data science, in general can be applied in real estate. Recruitment remains to be one of the most important components of growing a real estate agency. It also remains to be one of the most challenging, especially considering the competitiveness of the space and the amount of resources needed to hire a good agent...
Data Science Analytic Software Provider - Looking for good data science analytic software providers? InetSoft is a pioneer in self-service analytics whose platform also has built-in machine learning functions. View a demo and try interactive examples...
Data Analytics in the Insurance Industry - The first question to ask really is what do we mean by an analytical insurer. Personally we know that data and the use of data is not new in the insurance industry. In fact, we were using data in the form of MI 20 years ago, and we were putting in a spreadsheet and performing manual data analytics on it. We were able to actually use pivot tables. Things have moved on of course in those 20 years, and of course, nowadays we view the analytical insurer as an insurance company using analytics throughout the organization to improve business performance, with emphasis on the word throughout. Of course, many departments within the insurance business use some form of tactical analytics tools, such as for bidding claims or marketing or risk. Often those tactical analysis tools operate in silos, and the ability to exchange information between the different departments seems to be missing somehow. Really, the analytical insurer, by definition, has to have an enterprise wide view of the data and information available to them. Of course, never more has it been critical for an insurer to have an enterprise wide view than the current time. The slide in front of you reminds you that the insurance business really is quite an interconnected red fuse, for lack of a better expression. The issues of distribution, consumers both direct distribution and indirect through third parties and the emerging impact of Blockchain are factors. The customer is much more savvy, much more knowledgeable. The digital customer is becoming the norm, and of course, different customers behave in different ways...

Data Analytics Software - InetSoft Technology provides business intelligence software that is sure to meet the needs of any organization looking to grow. Developed with the customers in mind, our complete business intelligence suite, StyleBI, is a simple solution to some of your most difficult problems. InetSoft's software translates large sets of data into clear concise dashboards and/or reports.With StyleBI's unique and versatile features, companies can monitor and track their business from adolescence to maturity and beyond...
Data Analytics Software Samples - Searching for the best data analytics software samples? InetSoft provides examples from its highly-rated, easy to use dashboard analytics software...
Data Analyzing Software - Is your company's data too big and complex to understand? InetSoft is your solution. InetSoft is a business analysis software vendor. They sell data analyzing software. With InetSoft's data analyzing software and visualization results regarding internal and external performance can be found that a company would normally not see otherwise...
Data Discovery and Analysis Software - I’m going to focus the rest of this on that top right quadrant which is a big part of what we do. The concept is you connect to data source, and end users do some discovery and exploration and get insights. They see stories. They come to decisions, and then they deliver results to others in the enterprise. It could be that they deliver results out as visual chart in PowerPoint. It could be that they deliver results as a PDF distributed out to a list of 40,000 customers. They may now want to initiate a marketing campaign and send a mailing out, too. There are additional chart types over and above the display types and the reporting kinds of charts. There are charts that are more statistical, and there’s a lot of flexibility with data because in data discovery and analysis, it’s more ad-hoc. We can work with prepared and also unprepared data, excel spreadsheets or hundreds of source systems tables from an Oracle data warehouse...
Data-driven marketing: Connecting the dots - To adopt a sustainable culture of analytic reporting and strategy when it comes to developing marketing communications that matter, working with the right tools is essential. Working with cutting-edge BI tools and analysis solutions will empower you to curate and visualize your most vital marketing metrics in one centralized location. Not only will accessing your data in a visual format help improve your decision-making, but it will also allow you to interact with your insights and develop targeted campaign strategies that make a genuine impact...

Data Mashups vs. OLAP Cubes - It seems to me the whole concept of a mashup is that you really want to enable a very swift and agile world of analysis for your end users, and some of the dashboard products out there are getting a lot easier to use. There are data visualization technologies that are a lot easier to use than they were three-four years ago. So it all seems to be moving in that direction of empowering the end user to mix and match data sets. But it seems to me that ideally the beauty of a mashup environment, if it is done properly, is that you can essentially, I don’t want to say circumvent IT, but you can avoid a lot of the painstaking work required for building specific OLAP cubes. Is that a fair assessment? I think so. I think that it’s certainly enables the end users to act in an agile way. But for me, I also think that situational awareness is also important which is, if I come in the morning, and I have a really good dashboard I can look at my production data landscape and just see very quickly that everything is OK. Or I can look at the previous example of the UN country mashups and just see what’s going on. I don’t necessarily have to act. But if I was to try and gain that knowledge by reading reports, it would take me forever. I really wouldn’t have the time to do it. I wouldn’t be able to get there. So getting situational awareness in a sort of rapid manner that is easy to assimilate, I think is as critical as the ability to act in agile fashion...
Data Mining Software - Data mining software analyzes data from many different angles and compiles it into useful reports. Managers can use the information in these reports to increase their revenue and cut their costs. These applications allow users to examine data from a multidimensional standpoint in order to analyze correlations that are not immediately apparent...

Data Mining Tools - Data mining is the process of analyzing data from different perspectives and summarizing it into useful information that can be used to increase revenue and cut costs. Data mining allows users to analyze data from a multidimensional standpoint in order to sort and summarize any relations that are derived. It can be interpreted as the process of finding correlations among a multitude of fields in large relational databases. Companies use data mining to sift through data for market research, report creation, and report analysis. Technology innovation continuously increases capacity for analysis whilst driving down costs. Associations and correlations lead to discovery of information useful to a business. Sales, stock, shipping, and any other number of factors can tell a story and influence managers' decisions. Information attained this way allows for the discovery of historical patterns and trends that can help predict future performance...
Data Sharing and Analysis Between Enterprise Systems - This brings me to the next point. Why is there so much disconnection between enterprise systems from a data sharing and analysis standpoint? I mean given these information silos, is there a way for finance to leverage its investments more effectively? Well, without a doubt, the CFO has the opportunity based upon the knowledge that, if you didn’t have it before today’s webinar, then you hopefully walk away from it with. The ability to integrate and synchronize data to have what you might call one version of the truth is absolutely possible. Now there are challenges and certainly some of these information silos come from the disparate histories or roadmaps of technology acquisition, whether it was through companies being acquired or merged or if you were served by self-sufficient IT. There are a variety of reasons why the data may not be internally integrated, but it is entirely possible to do so, and there are good reasons why this makes good business sense. You can see here in the slide. You can see that I am showing you here in dark blue the users of a well-integrated mobile BI infrastructure, which implies, if you will, this data harmonization and that there are on-users, those who do not actually have this capability at all...
data.gov Analytics Solution - Looking for a good analytics solution that is compatible with data.gov? InetSoft's pioneering BI application produces great-looking cloud-based analytic views with an easy-to-use drag-and-drop designer. View a demo and try interactive examples...