Evaluate InetSoft's Decision Support System Dashboards
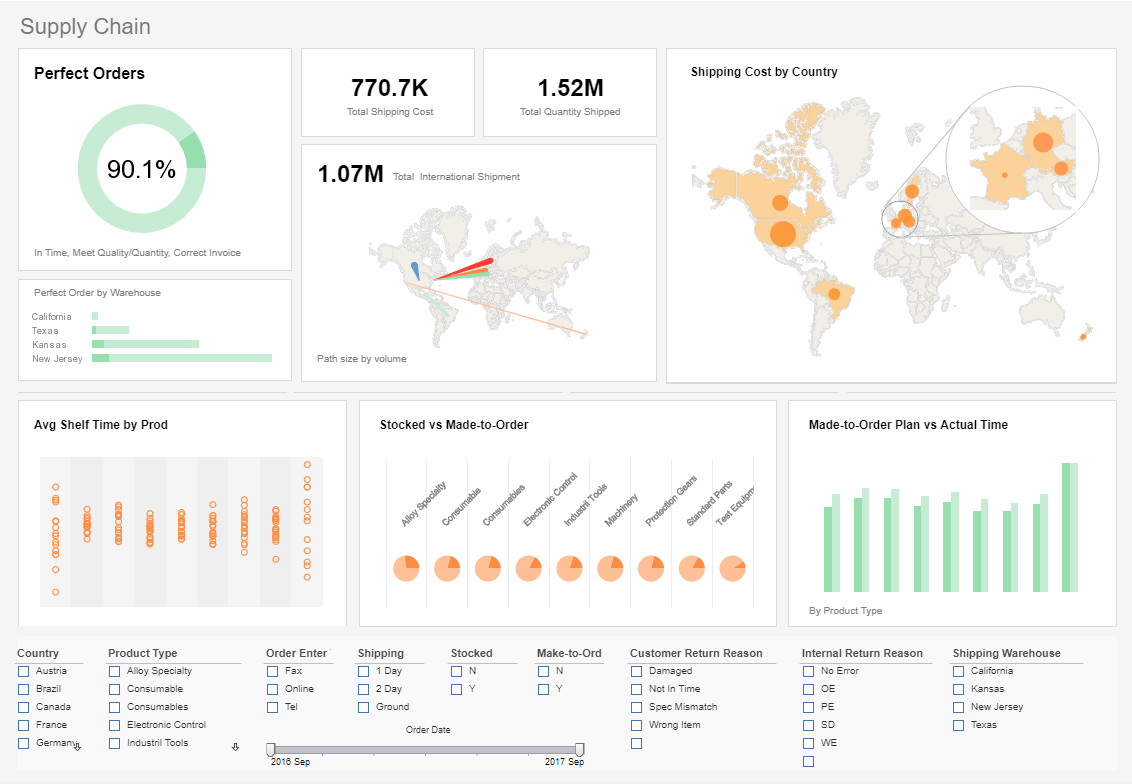
Are you looking for good decision support system dashboards? InetSoft's pioneering dashboard reporting application produces great-looking web-based dashboards with an easy-to-use drag-and-drop designer. View a demo and try interactive examples. All new customers get mentoring assistance for free to speed up their project delivery.

Register for more information and a personalized demo
About InetSoft
Since 1996 InetSoft has been delivering easy, agile, and robust business intelligence software that makes it possible for organizations and solution providers of all sizes to deploy or embed full-featured business intelligence solutions. Application highlights include visually-compelling and interactive dashboards that ensure greater end-user adoption plus pixel-perfect report generation, scheduling, and bursting. InetSoft's patent pending Data Block™ technology enables productive reuse of queries and a unique capability for end-user defined data mashup.
This capability combined with efficient information access enabled by InetSoft's visual analysis technologies allows maximum self-service that benefits the average business user, the IT administrator, and the developer. InetSoft was rated #1 in Butler Analytics Business Analytics Yearbook, and InetSoft's BI solutions have been deployed at over 5,000 organizations worldwide, including 25% of Fortune 500 companies, spanning all types of industries.

More Resources and Articles about InetSoft's Decision Support System Dashboards
Better Business Analysis and Decision Making - Are you looking for a way to increase profitability? Maybe you're searching for the ideal way of doing business. Perhaps you just want to know why your business is doing well, or how you can maintain that status. Fortunately, you can find the answer to all of the above inquiries through business analysis. Business analysis is the process by which you identify what your business needs and determine how you can best meet that need...
Better Hyperion Dashboard Reporting - Whereas Hyperion is a sophisticated BI tool for business performance, InetSoft's StyleBI provides a different level of interactivity and dashboard appeal. While other vendors offer advanced tools for operational use only, our software provides easy access and usage to any and all users with unique and intuitive data mashup capabilities. This allows users to combine disparate data from a multitude of supported data sources, including Hyperion Essbase...
Choosing a Dashboard System - Dashboard systems, also known as dashboard software, provide business users with an intuitive, easy-to-read, easy-to-use tool for monitoring their affairs. When a digital dashboard is created properly users are treated to a highly visual overview of their business. Choosing the right systems for your company may not always be the easiest task, however...
Considering a Dashboard Management System - Looking for a good dashboard management system? InetSoft, a pioneer in self-service oriented dashboard software offers an easy to setup system for creating interactive dashboards and analyses. Our customers rate our service as top performing on G2.com. View a demo and try interactive examples...
Cost Effective Subscription Dashboards - Since 1996, InetSoft's dashboard software, StyleBI™, has been one of the easiest and quickest ways to assemble and analyze enterprise data in a visually comprehensible manner. InetSoft has been delivering easy, agile, and robust business intelligence software that makes it possible for organizations and solution providers of all sizes to deploy or embed full-featured business intelligence solutions...
Dashboards Better than Epicor's - Looking for better Epicor executive dashboards? InetSoft, a pioneer in self-service oriented dashboard software allows for more personalization and supports data mashups across multiple sources for the broadest view of corporate performance. View a demo and try interactive examples...
Energy Usage Analysis Dashboard - The Usage Analysis Dashboard here exemplifies the powerful tools and features of InetSoft's interactive web-based analytical dashboard. As a pioneer in business intelligence solutions, InetSoft paves the way for dashboard, reporting, and data mashup solutions for organizations across different industries. By mashing up multiple data sets, users can create a visualization, like the chart below, to filter, sort, and analyze electric utility data...
Get a Risk Free Dashboard Offer - We create dashboards with your data (or mentor you to do so) You use the dashboards for free (as a single user)...
Examples of Database Dashboards - Is your business using database dashboards? These dashboards offer companies a unique way of representing their data. From sales projections, to employee statistics, and even inventory stock, database dashboards are able to easily represent all of the numerical data that your company can hold, into a visually appealing dashboard. Dashboards come in various different styles and presentations, and choosing the correct one can greatly affect your business. All dashboards will be able to present your data in some well formatted visual display, but database dashboards can integrate specific data from your company database that you need to present to employees or clients...
Important CFO Dashboards - There needs to be one version of the truth, one harmonized and integrated view of both internal data as well as access to external data. Being able to deliver mobile decision support in a role-specific way is another. Dashboards are critically important for the CFO and all CXOs, in fact, but the dashboard the CFO needs is quite different from what the head of operations and the head of sales needs...
InetSoft's Decision Support System - InetSoft is a business intelligence solution provider whose software is used by 25% of Fortune 500 companies in order to create a decision support system. InetSoft is top-rated by users on G2 Crowd. Interact with examples and register for a personalized demo...
Iterative Visualization Designer - Having data mashup and visualization design tightly coupled in a single web application allows a natural, iterative development process. This high productivity is not limited to design professionals. Since a user portal is also integrated in the web app, business users can easily engage with professional designers in the design process to minimize business and technology gaps...
Key Performance Indicators on Dashboards - Key Performance Indicators (KPI's) are business metrics used to track an organization's performance and determine whether business goals are being met. Every industry, agency, or organization must measure its performance on a daily, monthly, or quarterly basis to ensure health and sustainability. The best way to capture KPI's is through dashboard software. InetSoft's dashboards leverage KPI's by providing a dynamic, easy to understand visual display of an organizations most important metrics...

Machine Learning Dashboard Software - Mashup and visualization are coupled together as one web app. The mashup engine enables you to quickly profile data and verify data manipulations via data visualization. And while building visualization dashboards, you can also quickly add data transformations for more efficient visual output...
Picking the Best Performance Dashboard - Dashboards also grant the ability to manage people and quickly communicate information to them. They are especially helpful when problems arise as they deliver alerts and analyses, and allow personnel to tackle issues in real time. Ultimately, business performance is optimized using performance dashboards...
Project Status Reporting Solution - Effective project status reporting is essential for an organization's progress and should be implemented at all levels ranging from employees to owners and executives. The right status reporting software will make it easy to keep all of an organization's activities in check. Project managers foremost need project progress and coordination information such as dashboards displaying Gantt charts (see dashboard example)...
QuickBooks Reporting Partner - InetSoft's partner Bison Analytics helps executives scale up on QuickBooks with the power of StyleBI. The Bison System offers a 100% complete, end-to-end business intelligence environment specifically designed for QuickBooks. Bison provides everything top QuickBooks companies need to implement analytics quickly...not just a small piece of the solution. Bison Pro Services offers responsive, US-based support from business intelligence experts. Powered by InetSoft, Bison helps emerging businesses supercharge QuickBooks to drive growth...
Real Time Call Center Monitoring Dashboard Examples - Check out these real time performance monitoring dashboard examples to explore InetSoft's latest, powerful, BI and dashboard building software. This dashboard refreshes every 5 seconds, feeding the user a constant stream of live data. This is the essence of real time, and this aggressive and powerful BI strategy is extremely useful for helpline, auto dispatch, customer service centers and more...
Reporting Solution for Finance Departments - Finance departments are challenged everyday with more reporting demands by executives, boards and external agencies. This diverse audience also increasingly wants more transparent and quicker responses. On the other hand, CFOs want more analysis to discover opportunities and insights...
Reporting Visualization Tool for Data Scientists - Looking for a good reporting visualization tools for data science? InetSoft is pioneering BI platform offers analytics for ML models built in Spark. View a demo and try interactive examples...
Risk Management Software Partner - The Protecht Group is a leader in Enterprise Risk Solutions providing advanced training, advisory and risk management software solutions to its diverse client base. As part of their push to remain a leader in technology solutions, Protecht partnered with InetSoft in 2010 to integrate the InetSoft Business Intelligence application into Protecht.ERM™ to enable stunning visualization of data captured in Protecht.ERM...
Searching for the Best Operations Dashboard Solution? - Why implement InetSoft's dashboard solutions? InetSoft's StyleBI dashboards are vital tools for assessing and examining how well a business is being run, using key performance indicators to gauge current performance. Operations dashboards are utilized by managers and decision makers who are looking to make their current day to day affairs more efficient. In cases dealing with past of future occurrences, an analytical dashboard is typically preferred...
Simple Dashboard Design Solutions - The search for a simple solution to a complex problem is where Style Intelligence comes from. StyleBI is a fully interactive BI application that runs from the web. It only needs to be installed on one computer system in an office to give the whole employee roster access. It runs granular security permissions, keeping sensitive data safe while granting the full range of analysis capabilities to every user...
Starting a Dashboard Trial - Looking to start a dashboard trial? InetSoft offers Web-based dashboard software that enterprises can deploy quickly, and ISV's can embed easily into their own applications. Free evaluation download. View a demo. Read additional resources below...
Tools for Performance Management - Investigating performance management tools? InetSoft offers a software solution for dashboards, scorecards and visual analysis that can be easily deployed and used. Read articles below for related information, best practices, and tips...
Top Graphical Dashboard Options - Looking for the top dashboard options? InetSoft is a pioneer in business intelligence offering a dashboard tools that are easy to set up and use. View a demo and try interactive examples...
Various Types of Performance Dashboards - Performance dashboards should allow businesses to do the following: Monitor critical business processes and activities using metrics of business performance that trigger alerts when potential problems arise and when goals are met. Analyze the root cause of problems by exploring relevant and timely information from multiple perspectives and at various levels of detail. Manage people and processes to improve decisions, optimize performance and steer the organization in the right direction...
Visual Analytics Solution Evaluation - Since 1996, InetSoft has offered its visually stunning analytical dashboard software to enterprises and OEMs alike. InetSoft's StyleBI™ is a comprehensive platform that will redefine your consolidation, reporting, and performance management functions in one easy, agile, and robust dashboard. Visual analysis is a relatively new innovation in information management software that allows a person to explore data in an interactive, visual manner. At its simplest, it means charting and graphing data, but the novelty is in multi-dimensional charting and interactivity...
When to Automate Decisions and Actions - We see a lot of organizations looking at how to automate decisions and actions. Thinking back to the idea of embedding business intelligence in systems, organizations are certainly very much looking at how they can take decisions that are routine or repeated decisions and figure out how they can automate them using software...


