Interactive Dashboards
and
Maximum Self-Service
Powered by a Data Mashup Engine


Customer Service is the Best I've Encountered!
All the technicians are extremely knowledgeable, patient and will make every effort to accommodate your schedule and resolve the issue in a timely manner. - Jack from BOK Financial
Great Product and Easy to Use
I have been using this product for almost 2 years, and I find it simple to use and gives reliable results. I recently had a team trying to create a report for 2 weeks with another BI product. Since they couldn't build what they needed they came back to me. I was able to get it for them in less than a day with InetSoft. - Steven from Endurance Services
Register for more info and free software software
Sample Customers


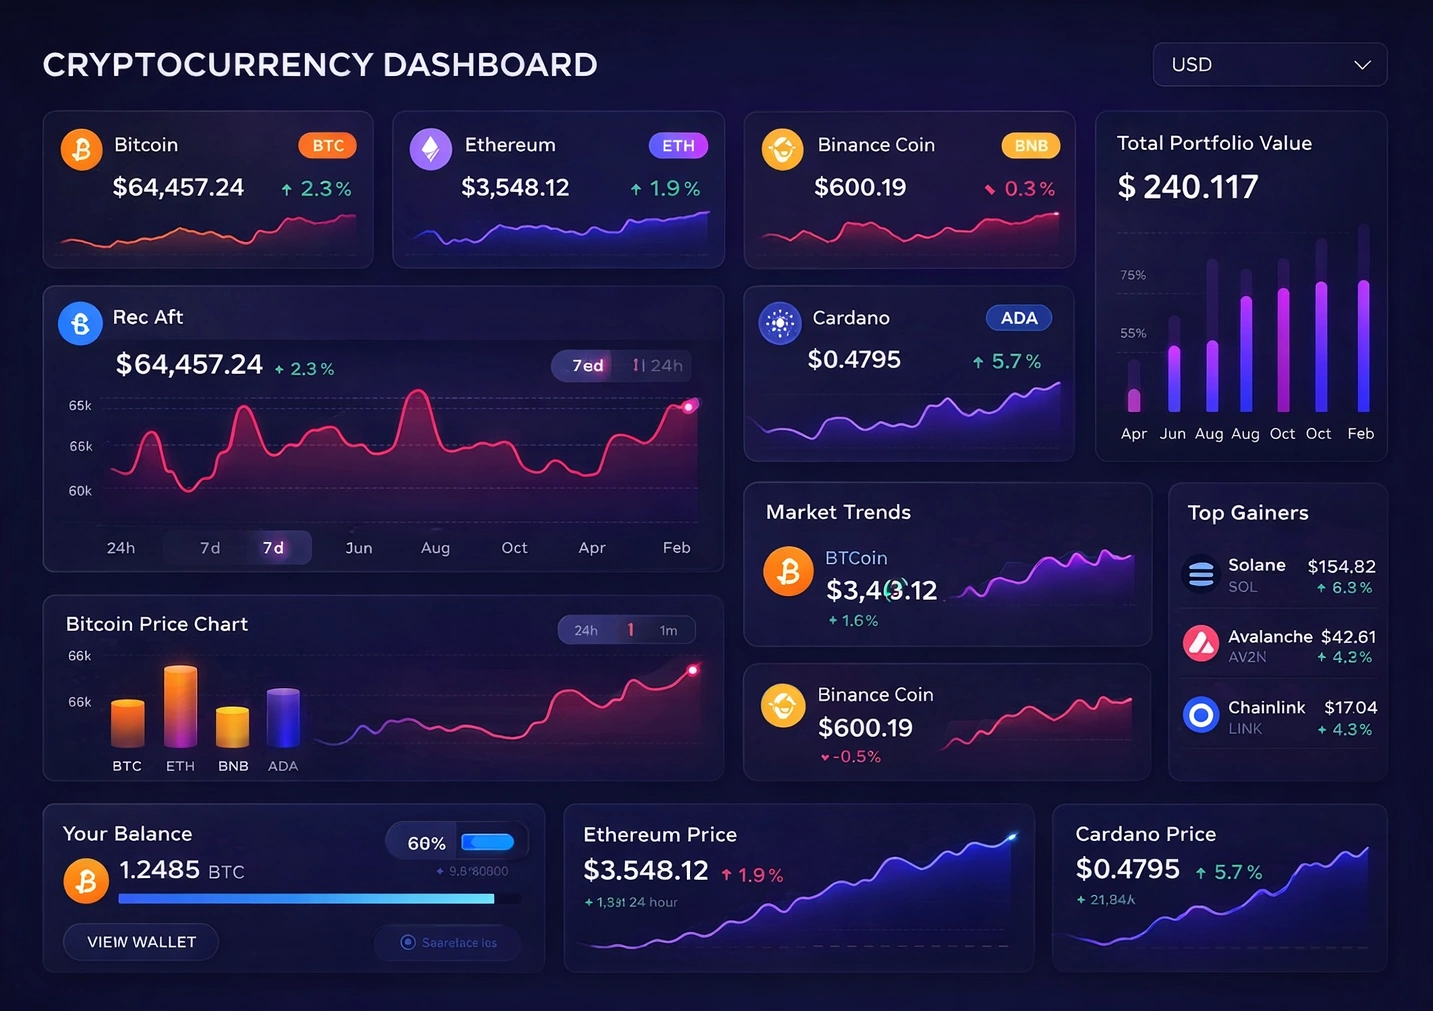
What Are the KPIs and Metrics Displayed on a Cryptocurrency Dashboard?
A cryptocurrency dashboard typically displays a variety of key performance indicators (KPIs) and metrics that provide insights into the performance, volatility, and overall health of the cryptocurrency market. These metrics help investors, traders, and enthusiasts track the value and trends of different cryptocurrencies and make informed decisions. Here are some common KPIs and metrics displayed on a cryptocurrency dashboard:
-
Price: The current price of various cryptocurrencies, typically displayed in real-time. This allows users to monitor price movements and identify potential buying or selling opportunities.
-
Market Capitalization: The total market value of a cryptocurrency, calculated by multiplying its current price by the total supply of coins or tokens in circulation. Market capitalization helps investors gauge the size and significance of a cryptocurrency relative to others in the market.
-
Volume: The total trading volume of a cryptocurrency over a specific time period, usually displayed in terms of the amount of currency traded (e.g., USD or BTC). High trading volume indicates active market participation and liquidity.
-
Price Change: The percentage change in the price of a cryptocurrency over different timeframes (e.g., 24 hours, 7 days, 30 days). Price change metrics help users assess short-term and long-term price trends and volatility.
-
Market Dominance: The percentage of total market capitalization represented by a specific cryptocurrency, such as Bitcoin's dominance in the overall cryptocurrency market. Market dominance metrics provide insights into the relative strength and influence of different cryptocurrencies.
-
Volatility: Measures of price volatility, such as standard deviation or average true range, help users assess the level of price fluctuations and risk associated with a cryptocurrency. High volatility may present trading opportunities but also carries higher risks.
-
Trading Sentiment: Indicators of market sentiment, such as social media mentions, sentiment analysis scores, or sentiment polls, provide insights into the collective mood and perception of market participants. Positive sentiment may indicate bullish trends, while negative sentiment may signal bearish sentiment.
-
Blockchain Metrics: Metrics related to blockchain activity, such as transaction volume, confirmation time, network hash rate, and active addresses, provide insights into the underlying network activity and health of a cryptocurrency's blockchain.
-
Technical Indicators: Various technical indicators, such as moving averages, relative strength index (RSI), and MACD (Moving Average Convergence Divergence), help traders analyze price patterns, momentum, and potential buy or sell signals.
-
Fundamental Metrics: Fundamental analysis metrics, such as adoption rate, developer activity, network upgrades, and partnerships, provide insights into the underlying fundamentals and long-term prospects of a cryptocurrency.
More Articles About BI Reporting Dashboards
Improving Repeat Purchases - One of the most effective ways for an organization to improve its sales is by upselling and cross-selling its offerings. But if you don't have hard facts at your disposal, it can be difficult to tell which pitches turn into actual transactions with your customer groups. By looking into different datasets such as your balance sheets, customer profiles, and customer loyalty programs, you can get the most out of your existing...
InetSoft's BI System - Researching BI systems? InetSoft offers business intelligence software for dashboards, reporting and mashups that can be easily deployed and used. Read articles below related to InetSoft's BI system. How Data Intelligence Can Improve The Energy And Utilities Sector - Dashboard software has the features and functionality to power up the energy and utilities industry in a number of key areas...
Lead-to-cashflow Metric - A marketing dashboard displays plenty of indicators and metrics that a marketing specialist should know and interpret. Once you have a look at the statuses, you will get an idea of where your project is. The tool allows spotting and fixing issues at the early stages. The idea is to analyze the reports in the shape of heat maps, scatter plots, and other visuals to decide how to improve the current activities and results. Here are some of the metrics provided by most marketing dashboards...
Rise of the Metaverse - Another key BI and data analytics trend to watch out for in the not-so-distant future is the valiant rise of the metaverse. A phrase that often pops up in science fiction films or literature, the metaverse is a digital realm where people can experience the internet in a highly immersive way. In this bold new world, you can enjoy gamification, apps, and content in a fully four-dimensional sense...